

Dear readers,
First off, my apologies, as this article is about a week later than I intended. Analyzing charts properly, in this form, takes a lot of time and I’ve had a busy schedule. Refer to the top left corner of each image for the date that each chart was captured. Either June 5th, or 6th, some during market hours. While this is not ideal, it has zero impact on the longer term analysis.
Otherwise, I’m back with another attempt to explain from an unbiased view, my technical analysis on the companies that “Pioneering Markets” follows. These are my personal opinions that I share for entertainment and educational purposes only.
Some minor format changes moving forward:
New title, as the previous one implied that each article was only backward looking.
I’ve put in bold my price targets for each bear and bull case for those that want to skim my explanations.
I’ve also activated the comment section so let me know what you think, ask questions or open up a discussion at the bottom of this page. 👇
Finally, check out my previous letter if you missed it as it may provide additional context for this month’s edition:

Technical Analysis
1. PKK / PKKFF – Historic volatility into Historic lows
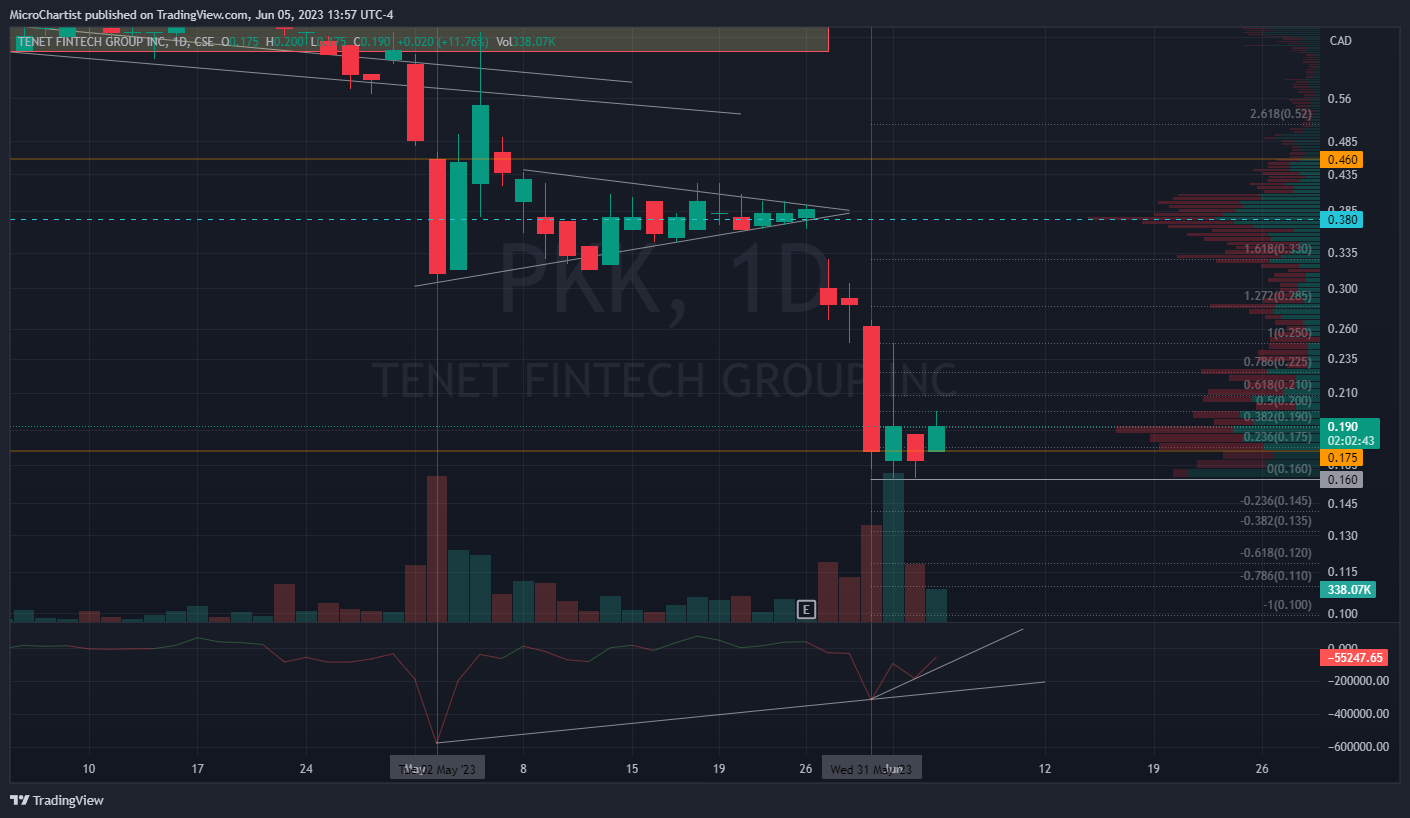
PKK / PKKFF Last Price $CAD 0.19 / $0.1393 USD
In the first 2 days of May, PKK went from a high of $CAD 0.65 / $0.48 USD to a low of $CAD 0.30 / $0.23 USD, a 53% decline, before clawing back almost 130% within 2 more trading days, bringing the stock price to a high of $CAD 0.70 / $0.52 USD.
The price then retraced between 40% - 54% lower forming a bearish pennant. Pictured above with the triangle. This forecasts a lower move to come, following a previous big move. The pennant then broke in the last 3 trading days of the month falling an additional 57%. All in all, the stock price closed 73% lower.
Bull Case: PKK is incredibly oversold and there are some signs of accumulation with the bullish divergences shown in the oscillator. This is shown with the higher lows in the oscillator despite the lower lows in price. I think the price can bounce to CAD$0.25 /$0.1861 USD and perhaps to around CAD $0.40 / $0.2978 USD.
Bear Case: Bearishness is the dominant trend, and the divergence in the oscillator is secondary to price. Meaning, I believe the trend will continue with the potential for it to go as low CAD $0.10 / $0.0745. This being said, anything can happen, especially when the price is at historic lows.
2. AMPD / AMPDF – Breakdown of range, into new lows
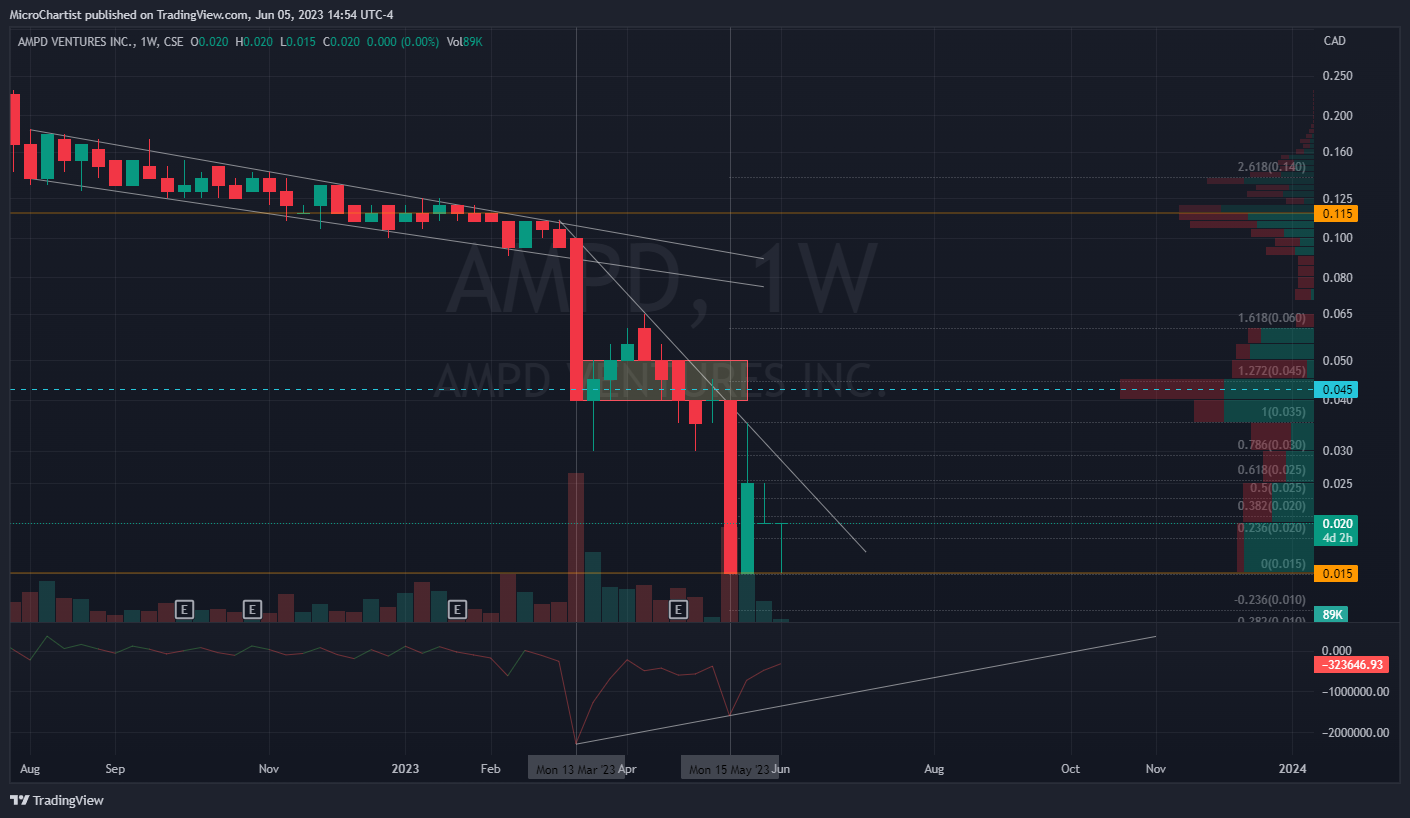
AMPD/AMPDF Last price: $CAD 0.02 / $0.0132 USD
AMPD began the month ranging in price around the box pictured above before breaking down and declining 66% from the high to the low. The price then climbed back ~130% and retraced again back to the lows at CAD $0.015 / $0.0076 USD.
Bull Case: AMPD is incredibly oversold with a bullish divergence and accumulation taking place. This can be seen with the bullish divergence in the oscillator and also with the overwhelmingly green bars in the volume profile indicator on the right side of the above image. This shows the amount of buying/selling at specific price levels, and in this case, there is a lot more buying than selling from CAD $0.015 / $0.0076 USD to CAD $0.03 / $0.0223 USD. That being said, with the proper momentum, I believe this can climb anywhere between CAD $0.04 - 0.07 / $0.03 - $0.052 USD and perhaps begin a reversal in trend.
Bear Case: Once again, price always comes first and the dominant trend here is bearishness, this outweighs the bullish arguments. Therefore, it’s possible and even likely that AMPD makes new lows at CAD $0.005 -$0.01 / $0,0074 - $0.0037 USD.
3. PBX / PWWBF – December 2015 prices
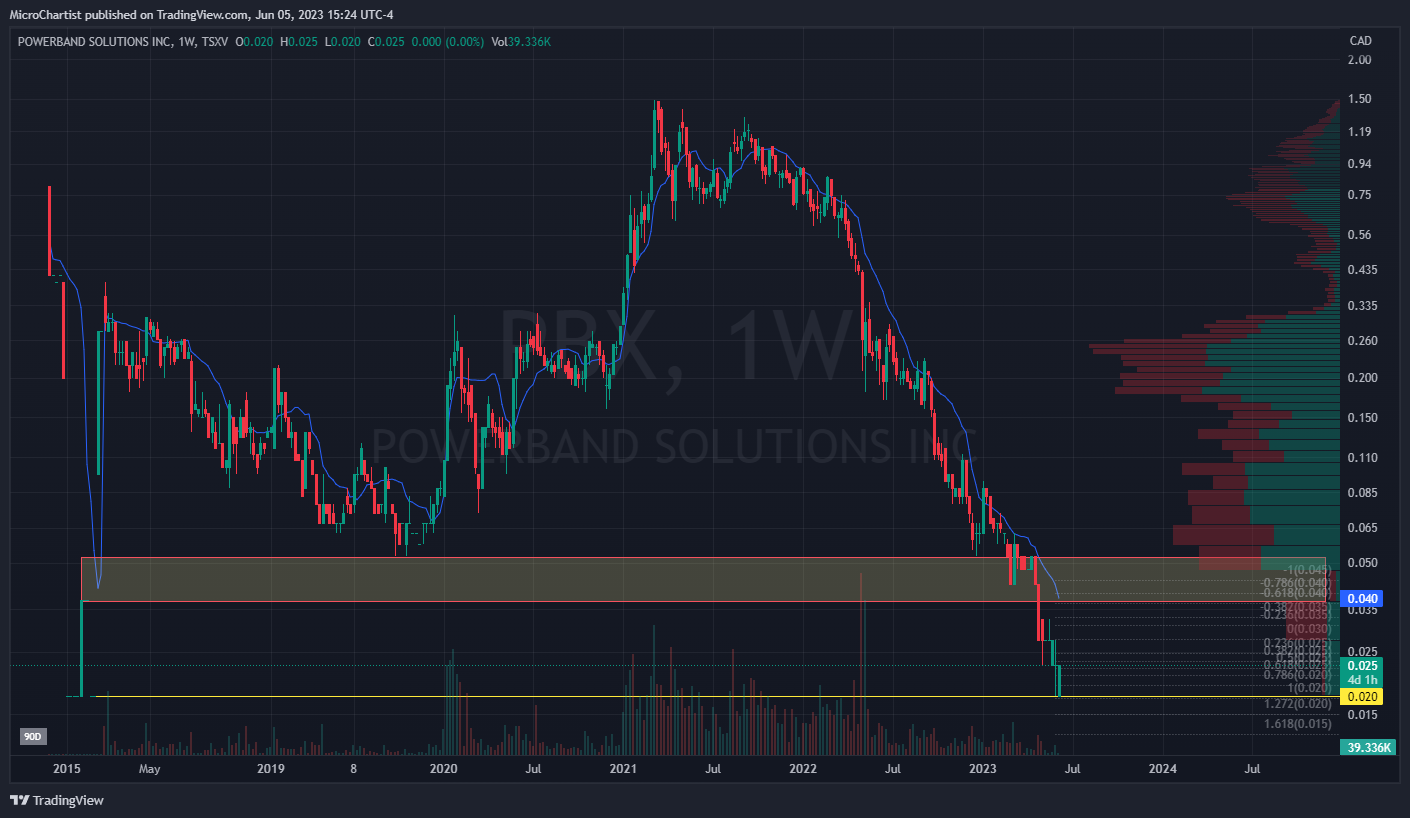
PBX/PWWBF Last price: CAD $0.02 / $0.0186 USD
PBX declined 43% from the monthly high to the bearish target that I had mentioned last month at CAD $0.02 / ~$0.015 USD, with heavy selling above CAD $0.03 / 0.022 USD.
Bull Case: The VWAP is sitting at about CAD $0.04 / 0.03 USD and the image above shows that it has mostly acted as resistance for the last year or so. So if some buyers step in I think the price can climb anywhere between CAD $0.03 - $0.04 / $0.022 - $0.03 USD.
Bear Case: Bearishness remains the dominant trend, and with the heavy selling that can be seen around CAD $0.03 / 0.022 USD, I think this is likely to make lower lows around CAD$ 0.015 / $0.0011 USD.
4. AUAG / AUXIF – Bounce from equal lows into consolidation
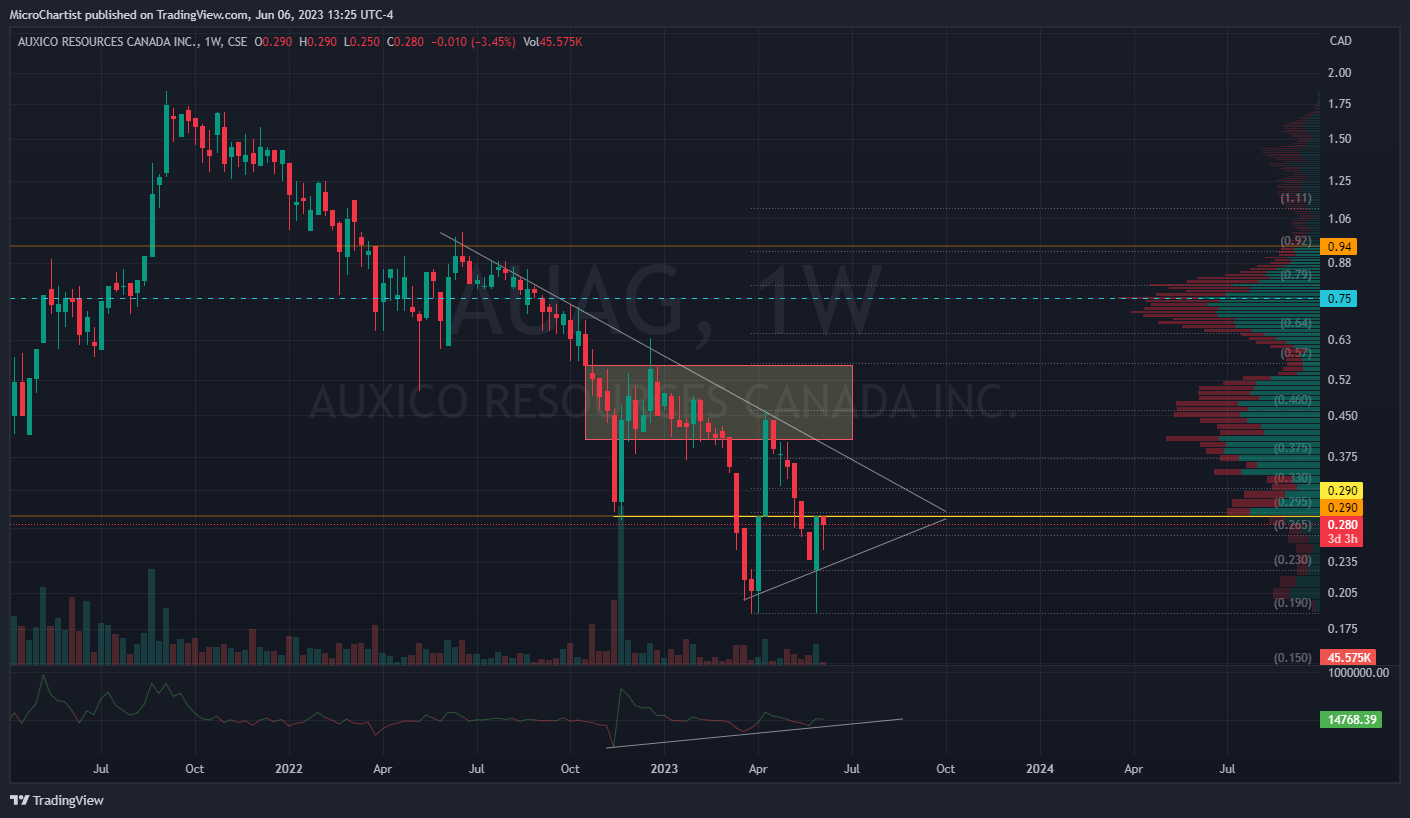
AUAG/AUXIF Last price: CAD $0.28 / $0.21 USD
After a strong performance in April, May gave it all back with a 100% retracement, until the final trading day and an 18% gain. This allowed the price to close well within the symmetrical triangle pattern, despite breaking below it temporarily. The symmetrical triangle is a consolidation pattern that usually signals a continuation in trend, but may also signal a potential reversal, depending on the direction of the breakout. This being said, there is once again a bullish divergence that can be seen in the oscillator which is also implying accumulation.
Bull Case: AUAG breaks Resistance at CAD $0.29 / $0.22 USD (Yellow line) and climbs to ~CAD $0.37 - $0.40 / $0.28 - $0.30 USD which is approximately the upper edge of the triangle and previous resistance, displayed with the box on the chart. A move with momentum can then breakout to CAD $0.56 / $0.42 USD for the beginning of a reversal in trend. Finally, The longer term target of the measured move could have the price climb to CAD $0.90 / $0.67 USD (To be taken with a grain of salt, a move like this would likely take longer than 1 month to play out.)
Bear Case: Another dominant bear trend here. Meaning that the price is likely to break to the downside of the triangle. This would likely result in a retest of the lows at CAD $0.19 (There are big discrepancies in the USD equivalent low, likely due to illiquid market sells). New lows could then bring the price to CAD $0.15, or to the completion of the measured move at CAD $0.10 / 0.075 USD. It’s to be noted that downside moves occur over much shorter periods of time, compared to most upside moves.
5. FOBI / FOBIF – Downward ranging
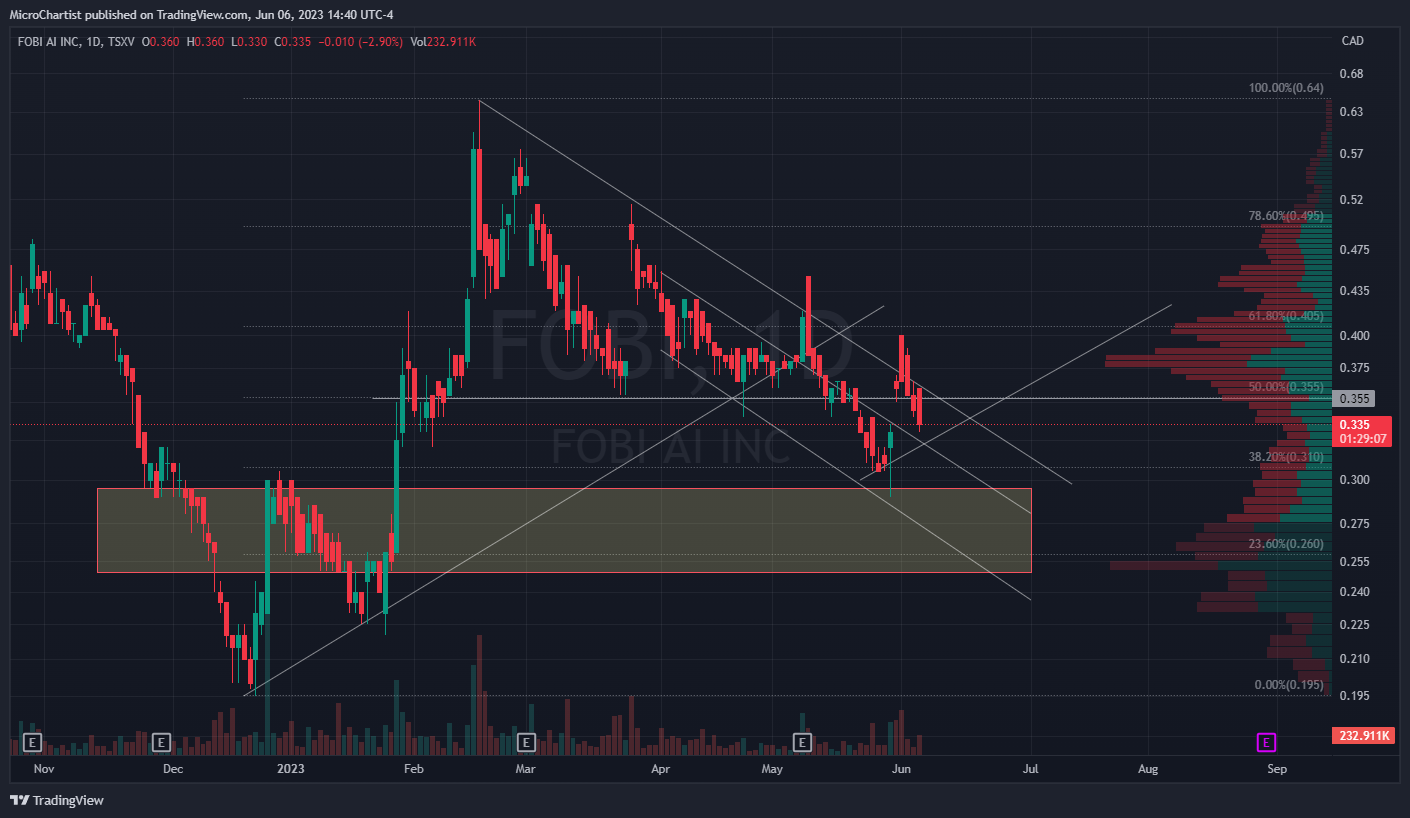
FOBI/FOBIF Last price: CAD $0.33 / $0.2447 USD
FOBI spent the last month ranging 25% to 40%. This can be seen with the gaps in the chart and big long candles. It’s otherwise forming downward ranges with lower lows and lower highs.
Bull Case: FOBI forms an equal or higher low around CAD $0.29 / $0.22 USD (This is from May 30th’s low) from which to form a double bottom and bounce from. This bounce would then likely reach CAD $0.41 / $0.31 USD. Where the price would ideally find a base before eventually continuing higher.
Bear Case: No exception here, bearishness is the dominant trend and FOBI even broke below it’s upward trendline that began in Dec 2022. It additionally lost support at CAD $0.35 CAD / $0.2611 USD, identified by the grey line. I believe that FOBI will decline to the box that’s identified between CAD $ 0.25 - $0.295 / $0.19 - $0.22 USD, based on the historic price structure. These prices also coincide with Fib. levels (This target remains unchanged from last month).
6. LNBK / LBNKF – Higher highs, Lower lows.
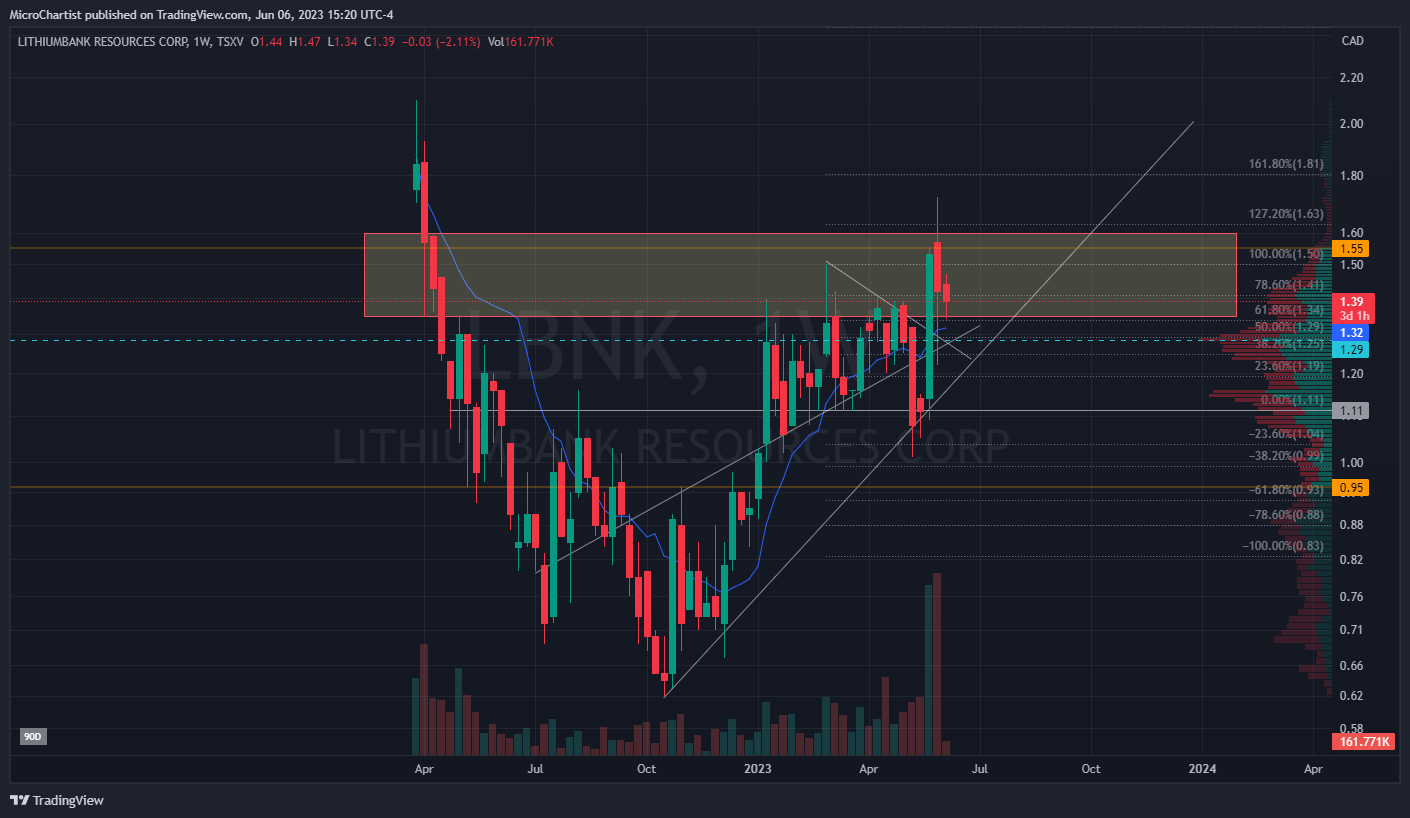
LBNK/LBNKF Last price: CAD $1.39 / $1.04 USD
LBNK started the month with an almost 30% decline, then followed that up with new, recent, highs and a 70% gain, before closing the month with a modest 1.46% decline. That being said, the price has shown strong support within the identified box. It is also sitting above the VWAP (blue line) and 3 fairly significant, longer term trend lines that may act as support. The volume profile, point of control, (light blue dotted line) is also sitting below price for additional support. Finally. there is historic accumulation with the most volume traded ever in the last 2 weeks.
Bull Case: Unlike all the preceding companies in this article, Bullishness is the dominant trend, and the more likely direction. I think support will hold around 1.30, but more time may be needed to build a stronger base around this level. The price can then break through the box at around CAD $1.60 / $1.29 USD and then to historic highs around CAD $1.86 / 1.39 USD.
Bear Case: Support breaks around CAD $1.30 / $0.97 USD and price declines to around CAD $1.15 / $0.86 USD. If that breaks, then the price may fall to CAD $1.00 / $0.75 USD.
7. VSBY / VSBGF – Equal lows and modest gains
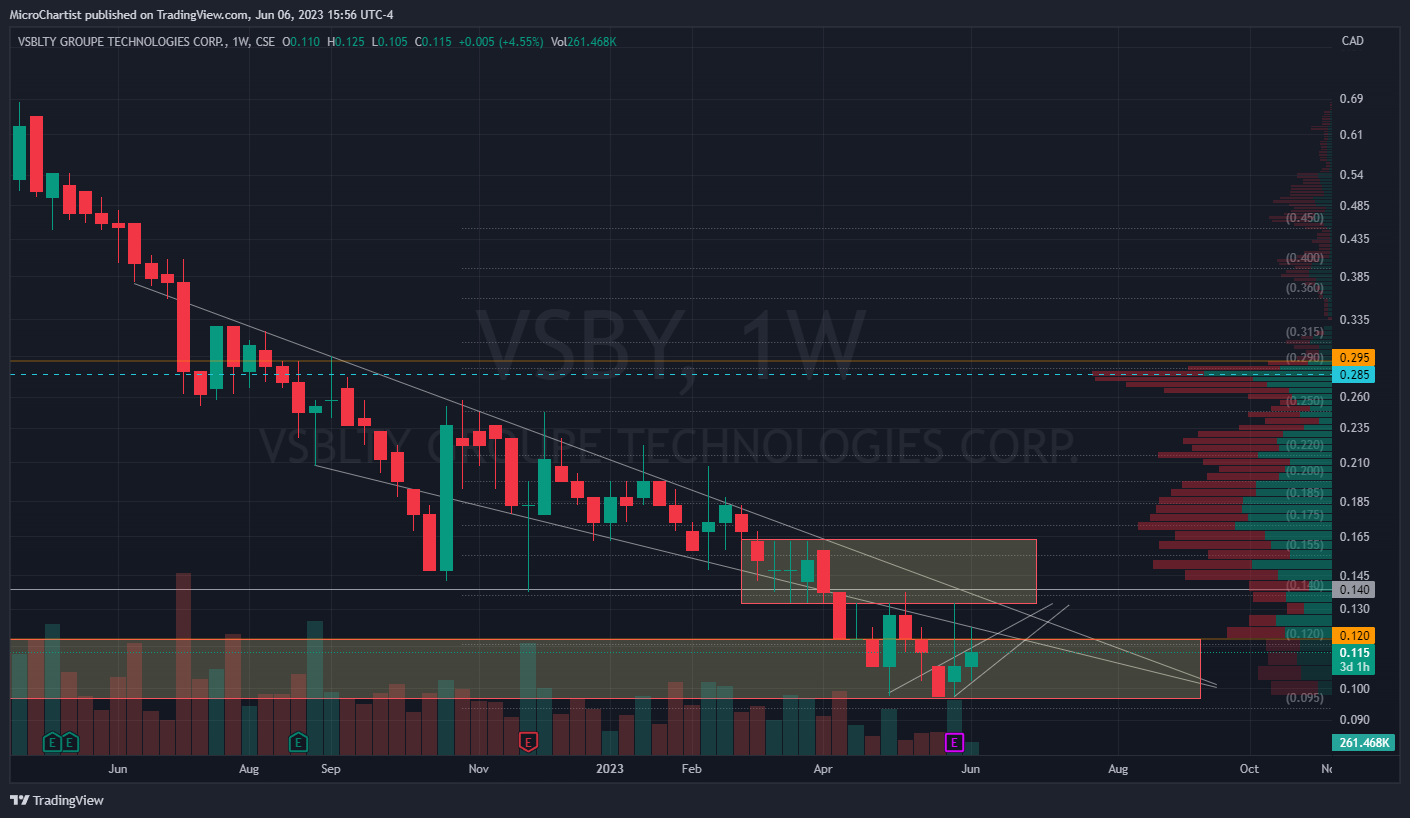
VSBY/VSBGF Last price: CAD $0.11 / $0.0857 USD
Surprisingly, the bull case played out last month in a potential trend reversal for VSBY. Unfortunately, it was unable to hold onto most of the gains but still managed to close the month 4.55% higher. We’ve thus far seen equal lows in June and multiple attempts of breaking out of the lower yellow box, with the price recently consolidating in a rising wedge pattern.
Bull Case: It takes a long time for a trend to fully reverse and there is a lot of resistance above the price. That being said, if price can break above CAD $0.12 / $0.09 USD it may then be able to climb anywhere between CAD $0.14 - $0.18 / $0.10 - $0.13 USD.
Bear Case: This remains the dominant trend for now. Last month’s bear case is maintained as price did not make lower lows. VSBY breaks below the identified range to make all time lows around the next Fibonacci levels between CAD $0.09 - $0.095 / $0.066 - $0.07 USD.
8. FANS / FUNFF – New all time Lows
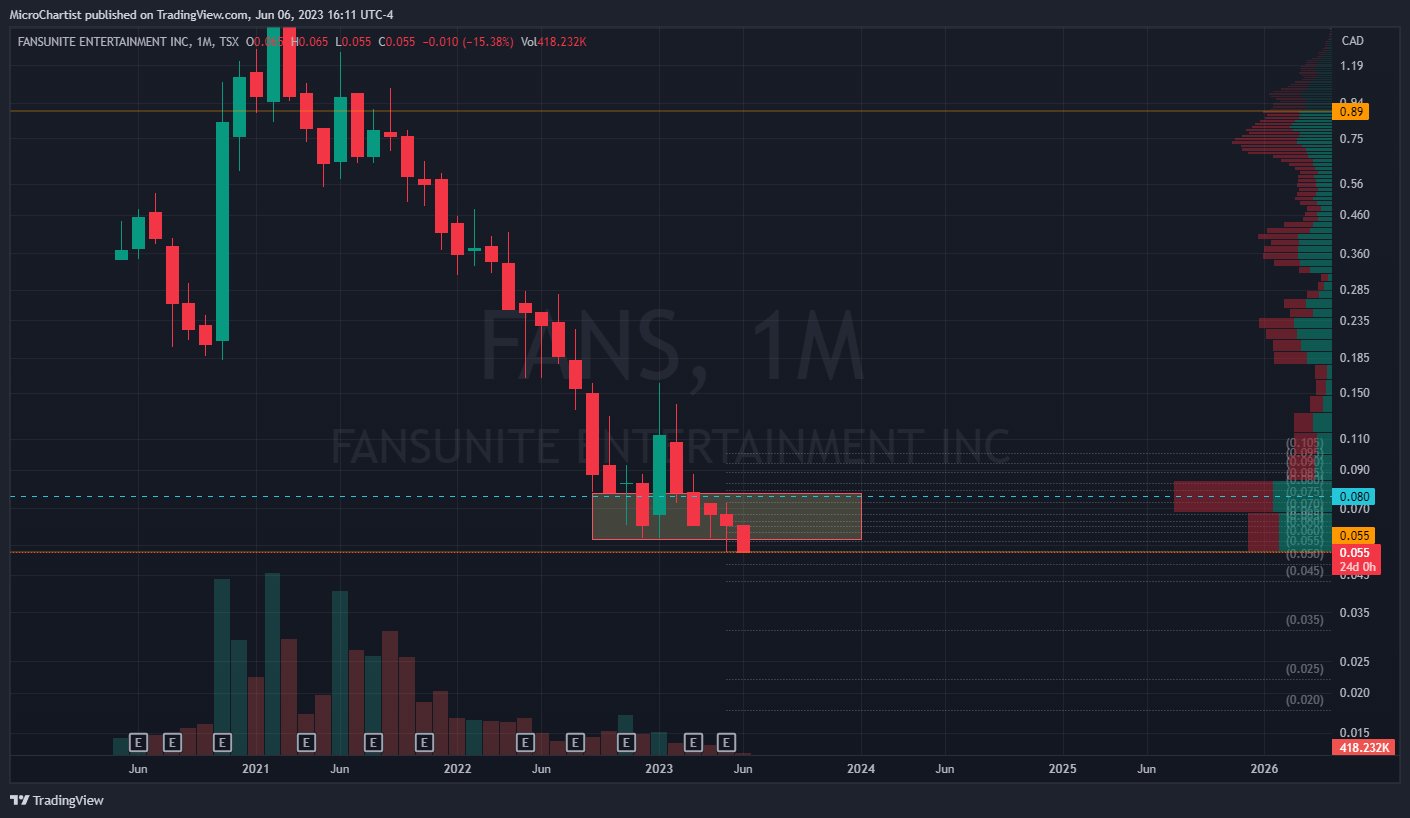
FANS/FUNFF Last price: CAD $0.055 / $0.0431 USD
FANS broke below the range that it had tested or traded within for the last 9 months.
Bull Case: FANS regains the upper end of the range at around CAD $0.08 / $0.06 USD. This could be possible as the price is oversold and may look to bounce.
Bear Case: It goes without saying, but this is the dominant trend. The price looks likely to make new lows between CAD 0.045 -$ 0.05 / $0.034 - $0.037 USD
9. ACT / ACTHF – Ranging with Equal lows.
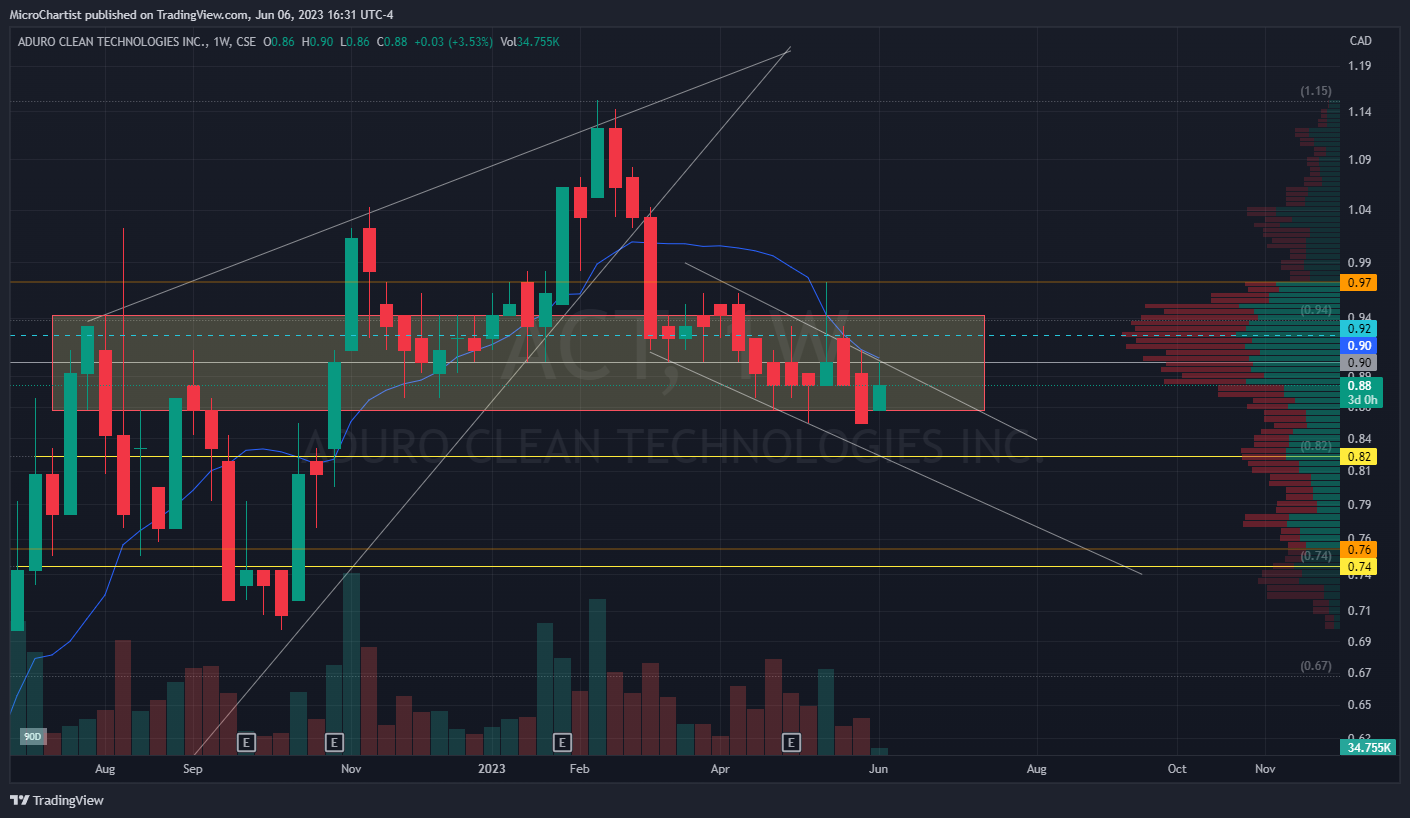
ACT/ACTHF last price: CAD $0.88 / $0.65 USD
ACT pushed the lower range of the rectangle pictured above and made equal lows at CAD $0.85 / ~0.63 USD. This sets ACT up for a potential double bottom, which is a reversal pattern, for the shorter term trend.
Bull Case: The longer term trend is bullish, giving the double bottom reversal pattern a higher likelihood of playing out. The price would need to break above and hold CAD $0.90 / $0.67 USD to start this short term reversal. The price would need to break above CAD $0.94 / $0.70 USD, for a chance at CAD $1.00 / $0.75 USD. A break of those levels would then give it a possibility of hitting recent highs at CAD $1.15 / $0.86 USD
Bear Case: Last month’s bear case remains the same. The support at CAD $0.85 / ~0.63 USD may be lost if that price is retested. In that case, I believe a more likely floor will be at CAD $0.82 / $0.60 USD and if that breaks then I think the price may drop to CAD $0.74 / $0.55 USD. Both of these prices coincide with the next fib retracement levels and they align with the chart’s historical prices.