

Dear readers,
I’m back with another attempt to explain from an unbiased view, my technical analysis on the companies that “Pioneering Markets” follows. These are my personal opinions that I share for entertainment and educational purposes only.
In case you missed it, check out last month’s article for additional context on this edition 👇

Technical Analysis
1. PKK / PKKFF – Bullish fake out & trap?
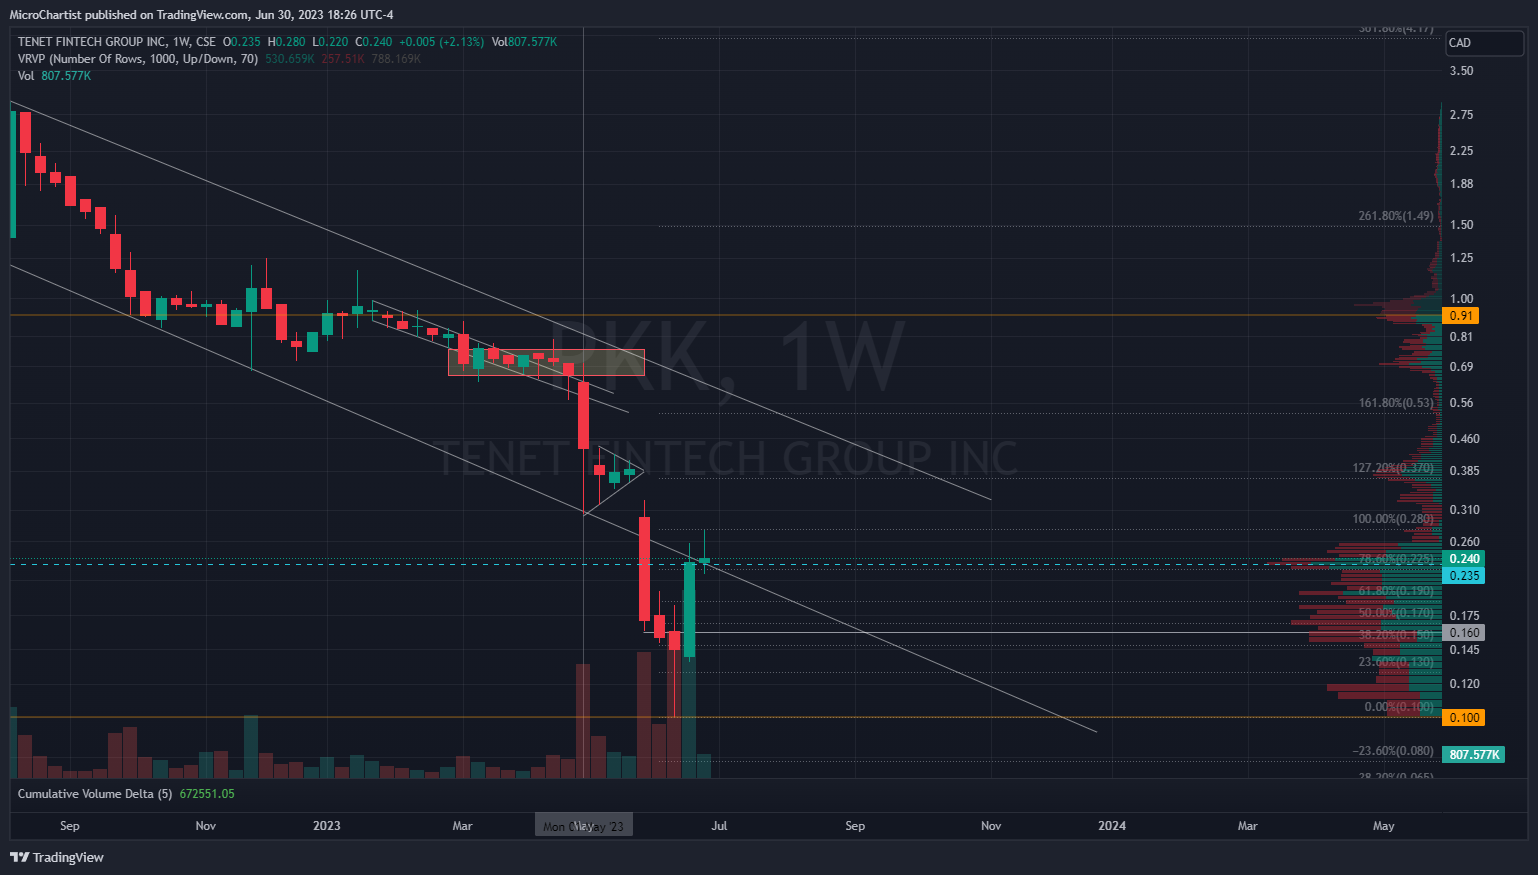
PKK / PKKFF Last Price $CAD 0.24 / $0.1608 USD
June 1st started with a 56% gain from the low to the high of day, before retracing into all time lows at CAD $0.10 / $0.0756 USD and a 58% decline over the first 2 weeks. In the remaining 2 weeks of June, the stock price climbed over 180% from the low and held 140% of it’s gains into the monthly close. Despite all this, the dominant trend remains bearish with lower lows and lower highs month over month. Last month, I had a bull case of CAD $0.25 and a bear case of CAD $0.10, both of which were hit.
Bull Case: The trend reversal is sustained and support around CAD $0.22 - $0.24 / $0.14 - $0.16 USD holds. PKK may then be able to close the gap to CAD $0.37 / $0.28 USD and perhaps climb higher to CAD $0.45 / $0.34 USD with increased volume.
Bear Case: Trends are more likely to continue than to reverse. With this in mind, the bear case is still more likely here. The long wick on the most recent weekly candle also signals a potential top. I believe that the price is likely to retest CAD $0.15 / $0.11 USD before retesting recent lows at CAD $0.10 / $0.076 If new lows are made the price may fall to CAD $0.08 / $0.06 USD.
2. AMPD / AMPDF – Barcoding and new lows.
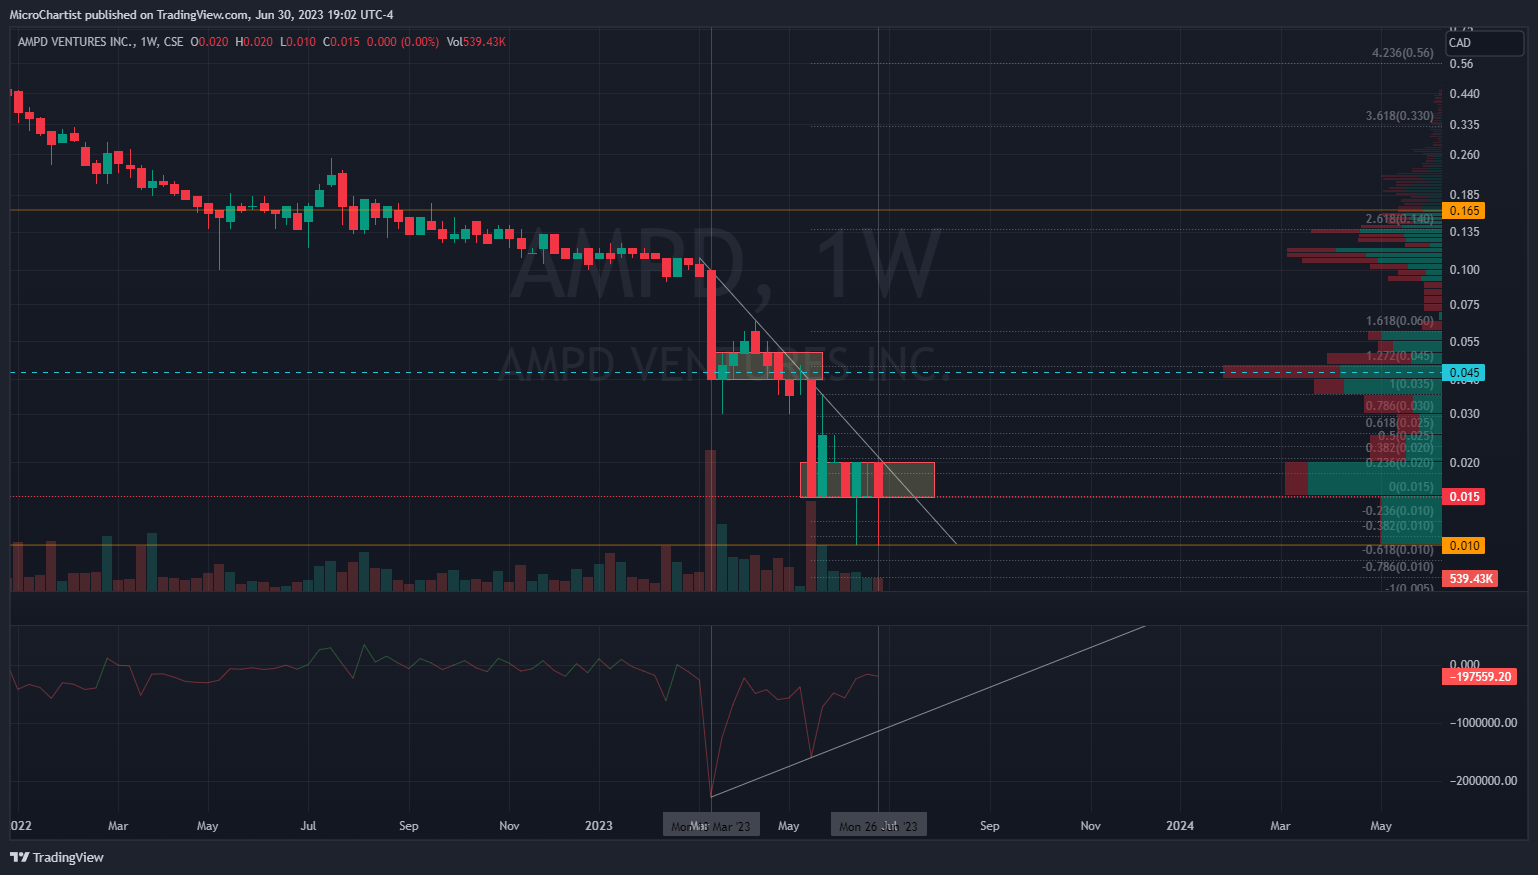
AMPD/AMPDF Last price: $CAD 0.015 / $0.0108 USD
This one’s titled Barcoding because the price for the most part ranged from CAD $0.015 to CAD $0.02, and it’ starting to look like a barcode. There were, however, two exceptions where the price made new lows and touched CAD $0.01, but closed above it. $0.01 was last month’s bear case.
Bull Case: There isn’t much to be bullish about, but there is a silver lining: Heavy accumulation can be seen from CAD $0.01 - $0.015 through the volume profile and the bullish divergence within the oscillator. The green bars on the right of the image indicate heavy buying, compared to the smaller red bars in the Volume Profile. This implies limited selling at specific prices. As for the oscillator, look for the 2 grey vertical lines connecting the chart to the oscillator. The lines are meant to emphasize the rising oscillator, despite the declining stock price. This is bullish divergence and it implies accumulation. That being said, the price would need to close at CAD $0.02 and eventually sustain a price of CAD $0.025 to make a higher high and increase the chances of continued bullishness.
Bear Case: Bearishness is the dominant trend. The price may start ranging at a lower level between CAD $0.01 - $0.015 with a potential for new lows at CAD $0.005.
3. PBX / PWWBF – Support holds with signs of life?
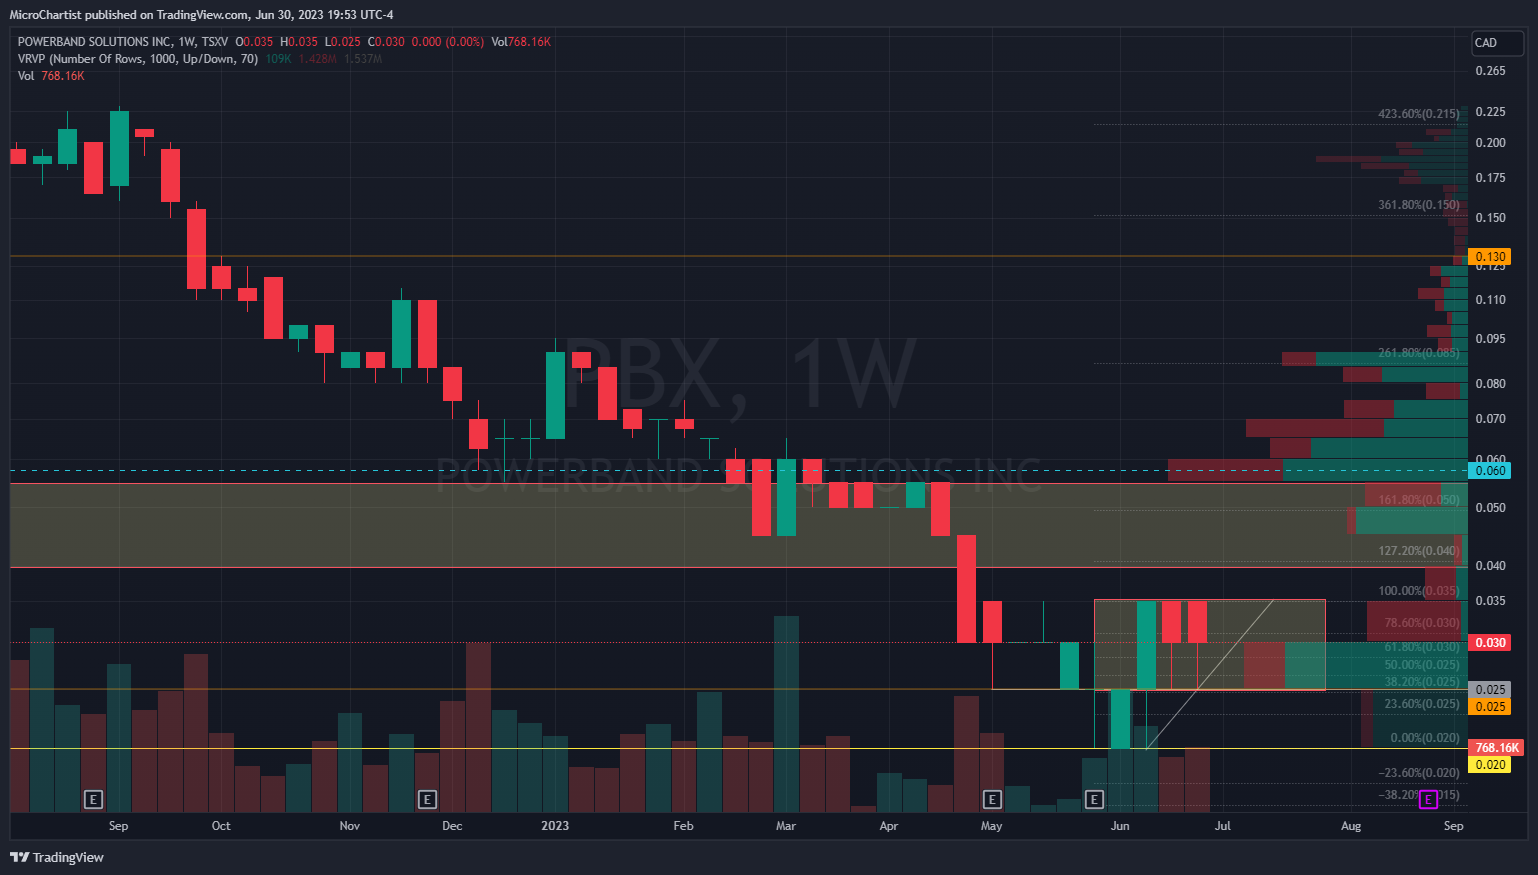
PBX/PWWBF Last price: CAD $0.03 / $0.02 USD
PBX Managed to secure a 20% gain to close the month and achieve the lower end of my Bull Case last month at CAD $0.03.
Bull Case: PBX climbs to a high of CAD $0.055 / $0.042 USD, to break above the upper box/historic range. This could then signal the start of a potential trend reversal.
Bear Case: Bearishness is the dominant trend and there’s heavy selling that can be seen in the Volume Profile at CAD $0.035 - $0.04. This likely means that the buyers at CAD $0.02 - $0.025 are flipping their shares for 60% - 100% gains. Because of this, a new range may begin from CAD $0.02 - $0.04, with eventual dips to new lows at CAD $0.015.
4. AUAG / AUXIF – Breakdown of Triangle
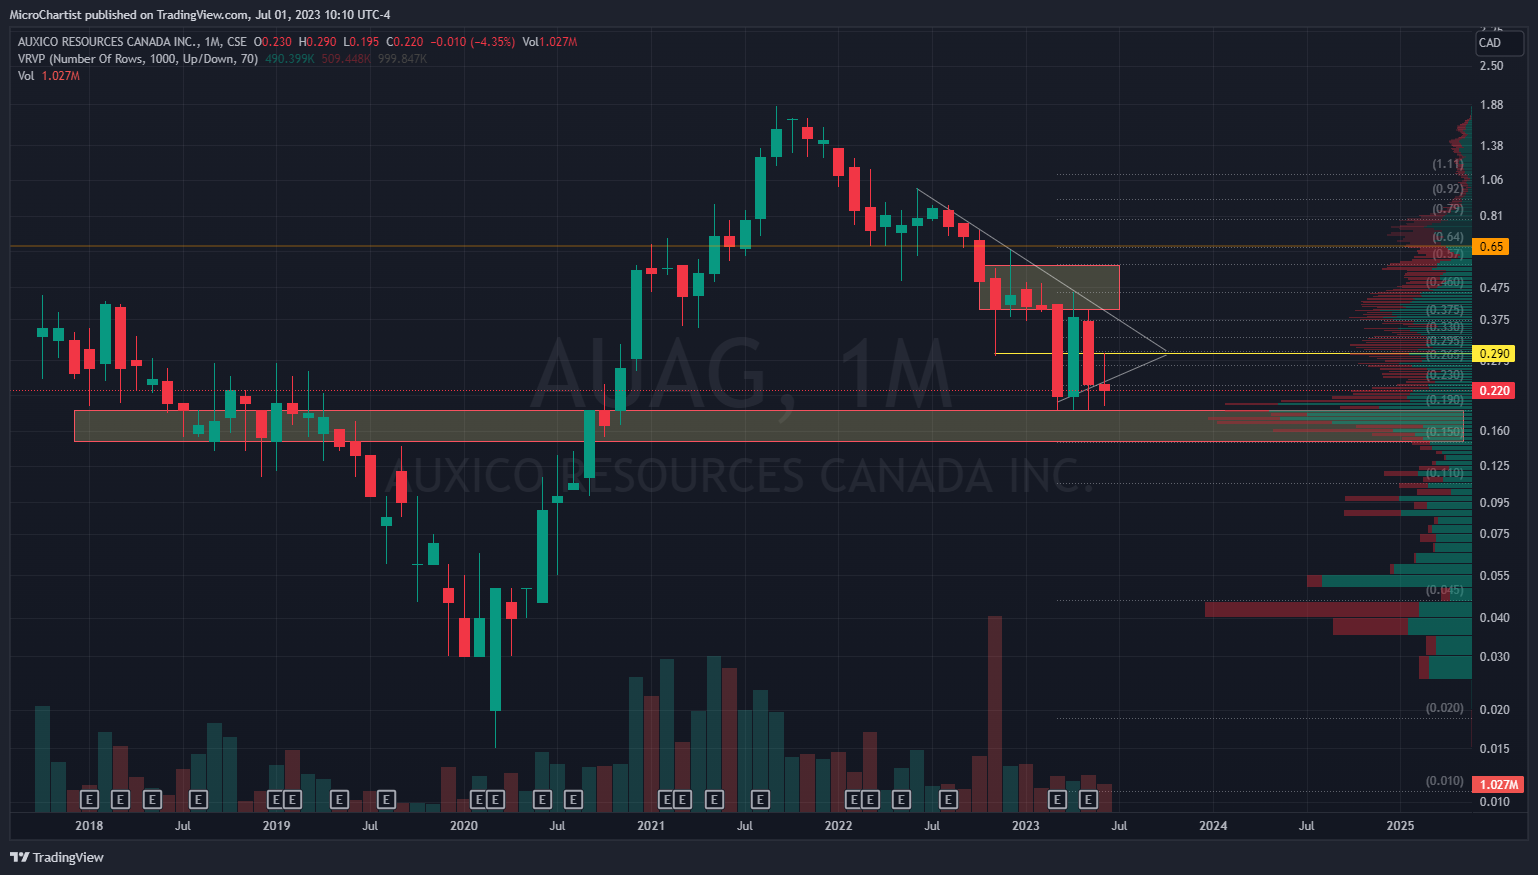
AUAG/AUXIF Last price: CAD $0.22 / $0.1884 USD
AUAG failed to break through resistance last month and instead retraced to its lows, breaking below the multi-month triangle, and closing beneath it. This break usually signals the next leg down, and the lower trend line of the triangle should now act as resistance.
Bull Case: Despite the break below the triangle, AUAG should have support between CAD $0.15 - $0.19 / $0.11 - $0.14 USD based on it’s historic price levels and Volume Profile, which shows a big liquidity zone. A new low may serve as a bear trap in this case, before giving AUAG a chance to retest resistance at CAD $0.29 / $0.22 USD (Yellow line).
Bear Case: Bearishness is the dominant trend and support at CAD $0.19 has been tested a lot over the last 4 months. This increases the chances of it breaking. New lows are likely anywhere between CAD $0.15 - $0.18 / $0.11 - $0.14 USD. Otherwise, the measured move of the triangle-break would be completed at CAD $0.11 / $0.083 USD, which coincides with the Fibonacci retracement level.
5. FOBI / FOBIF – Ranging lower
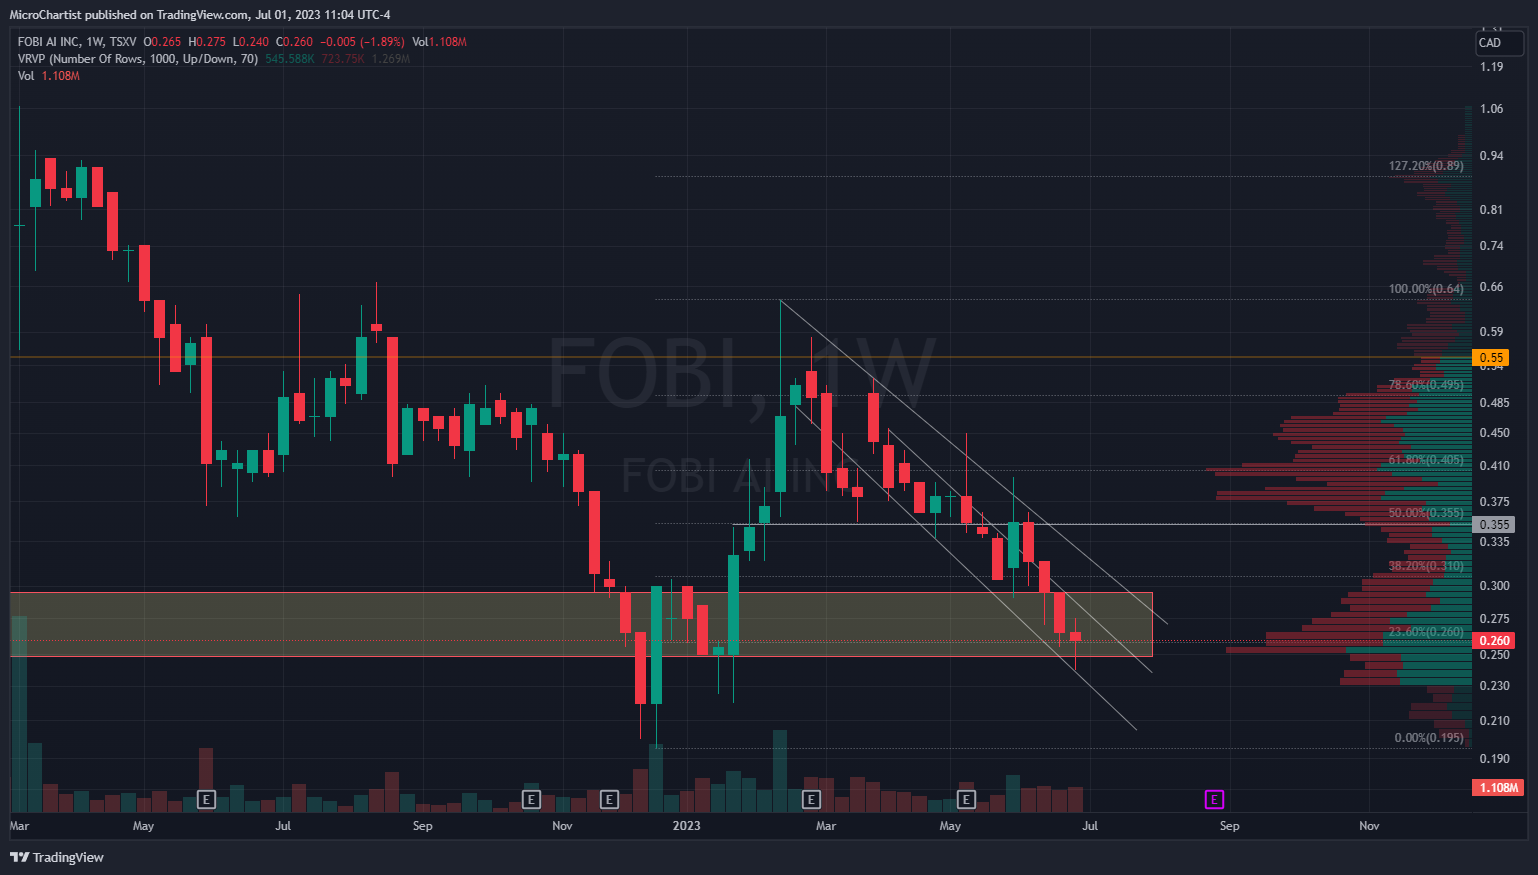
FOBI/FOBIF Last price: CAD $0.26 / $0.20 USD
FOBI spent the last 4 weeks moving downwards for an almost 30% decline in the month. It’s now on track to get back to it’s 52 week lows. This being said, the bear case played out last month with the price falling within the yellow box that was identified.
Bull Case: Support holds around CAD $0.25 / $0.19 USD and the price manages to break above CAD $0.30 / $0.23 USD. It may then be able to make a run to CAD $0.36 - $0.40 / $0.27 - $0.30 USD.
Bear Case: Support breaks and the price retests 52 week lows at CAD $0.195 / $0.1439 USD. A new range may then begin between CAD ~$0.20 - $0.25 / $0.15 - $0.19 USD. Otherwise, new lows could be made around CAD $0.15 / $0.11 USD.
6. LNBK / LBNKF – Continuation with a Bullish Flag
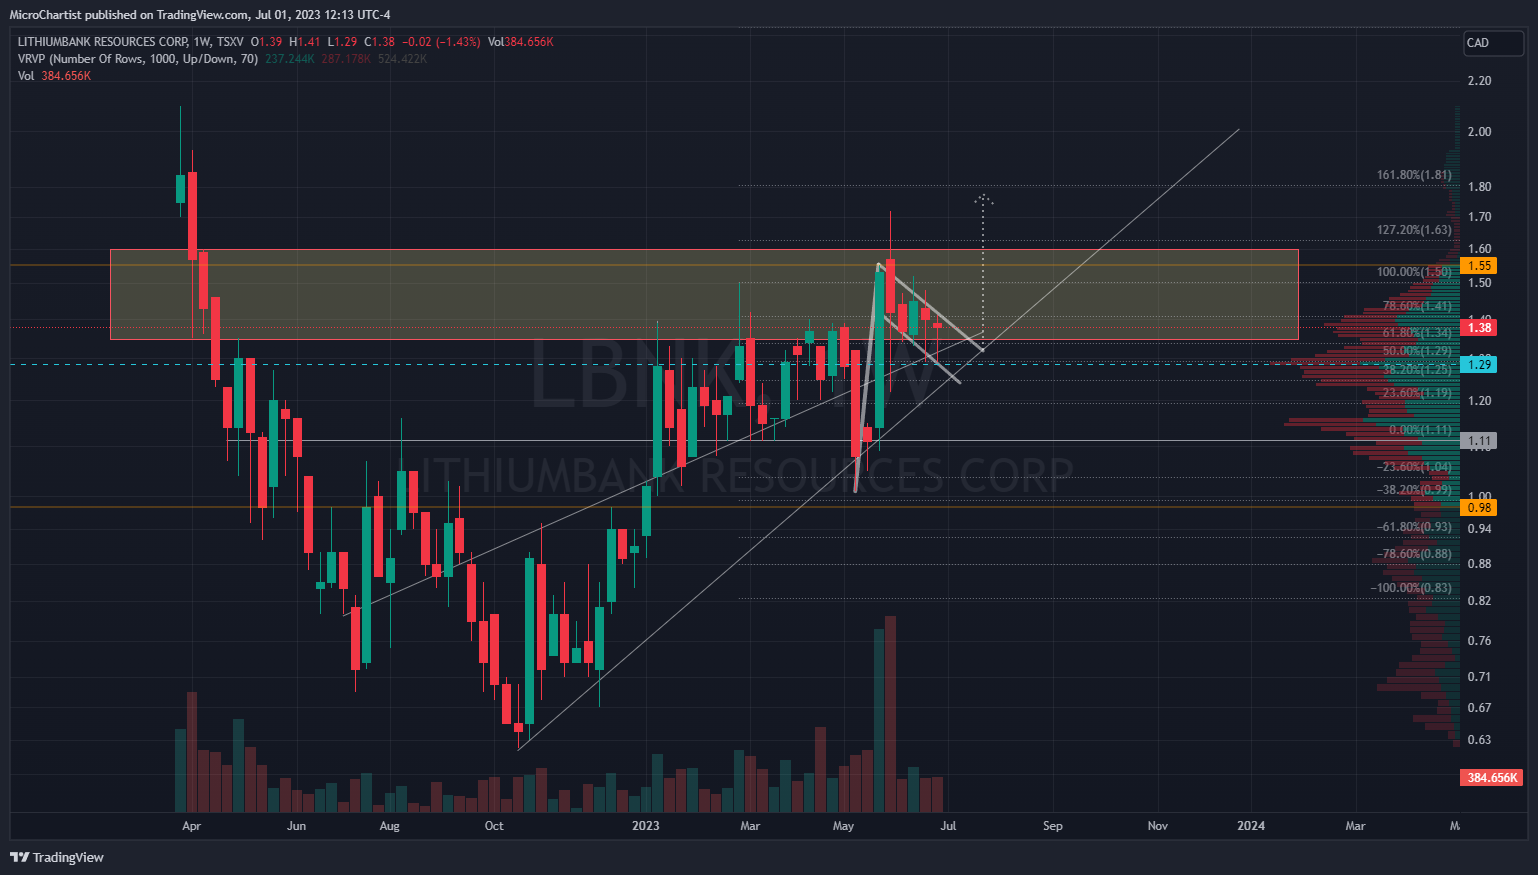
LBNK/LBNKF Last price: CAD $1.38 / $1.04 USD
Last month, I stated that LBNK may have needed more time before the next move and that I expected support to hold around CAD $1.30 / $0.98 USD. That’s exactly what happened, with a bullish flag having formed. This can be seen with the thick grey lines that form a “flag & pole” shape. The dotted arrow represents the measured move.
Bull Case: The dominant trend is bullish, so I’d say that this is the most likely outcome. The bull flag succeeds and the measured move takes place to bring the price anywhere between CAD $ 1.80 - $2.00 / $1.36 - $1.51 USD. I’d expect this move to take place this month.
Bear Case: The bull flag fails, and the price breaks below the lower trend line, to around CAD $1.20 / $0.91 USD.
7. VSBY/VSBGF - All Time Lows & Bounce.
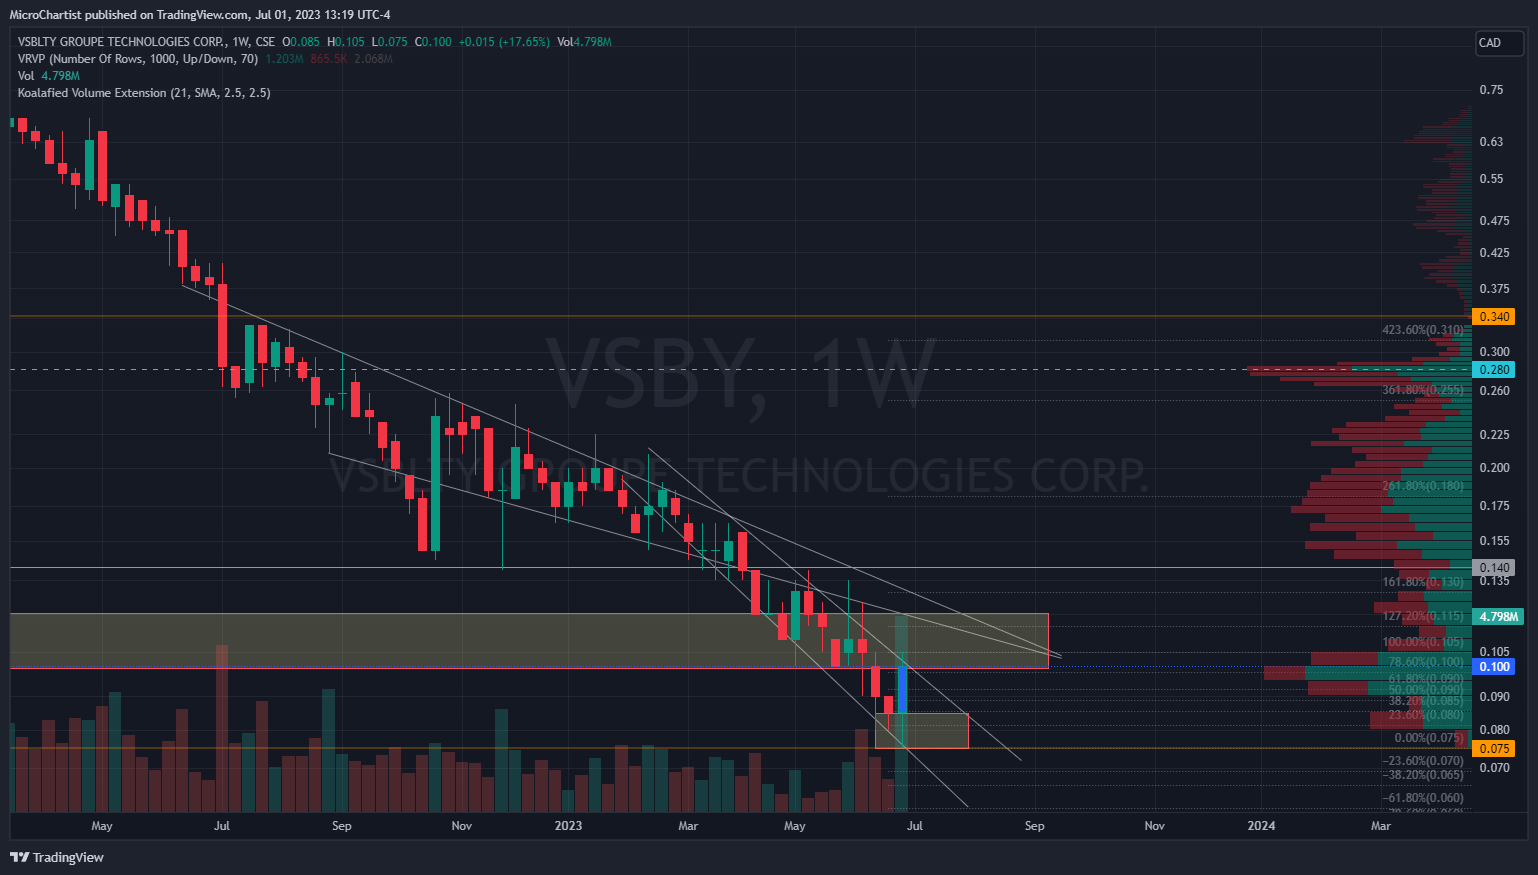
VSBY/VSBGF Last price: CAD $0.10 / $0.077 USD
VSBY declined 40% from the high to the low of the month, before a huge uptick in weekly volume and an 18% gain, closing out the month 13% lower. That being said, last month’s bull case was achieved, before declining below the bear case that was identified.
Bull Case: The bull case is more or less the same as last month. Price will need to break above CAD $0.12 / $0.09 USD which is the top of box. It may then be able to break above it, to climb anywhere between CAD $0.14 - $0.18 / $0.10 - $0.13 USD.
Bear Case: The dominant trend is bearish, and I believe that a new range may form between CAD $0.075 - $0.085 / $0.057 - $0.064 USD, before breaking to new lows as low as CAD $0.055 / $0.042 USD. This would equal a 50% decline, from the recent high and is a significant Fibonacci level.
8. FANS / FUNFF – New all time Lows
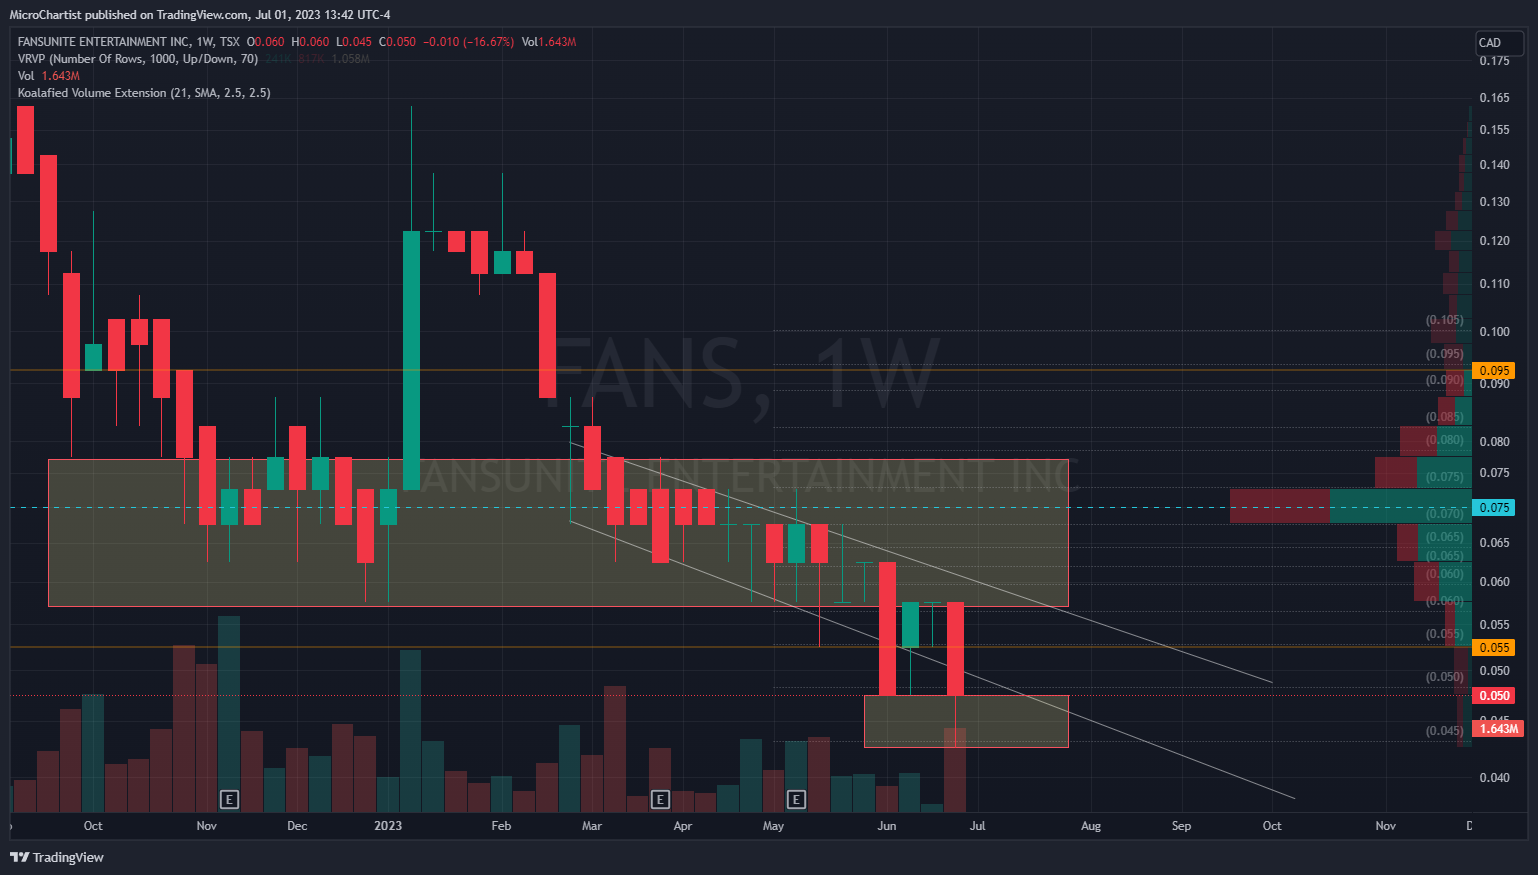
FANS/FUNFF Last price: CAD $0.05 / $0.0382 USD
The month of June had a loss of a 10-month range, with 3 weeks of failed retests and a breakdown to all time lows. That being said, last month’s bear case was confirmed.
Bull Case: There’s a chance for a larger move to CAD $0.075 / $0.057 USD, as this is where the historic point of control is. In other words, it’s the level at which the most volume has traded. Price has a tendency to range around that level.
Bear Case: Bearishness is the dominant trend. Implying, that FANS is likely to retest and make new lows. The price may fall to CAD $0.035 / $0.026 USD
9. ACT / ACTHF – Multi-Month Choppiness
ACT/ACTHF last price: CAD $0.88 / $0.67 USD
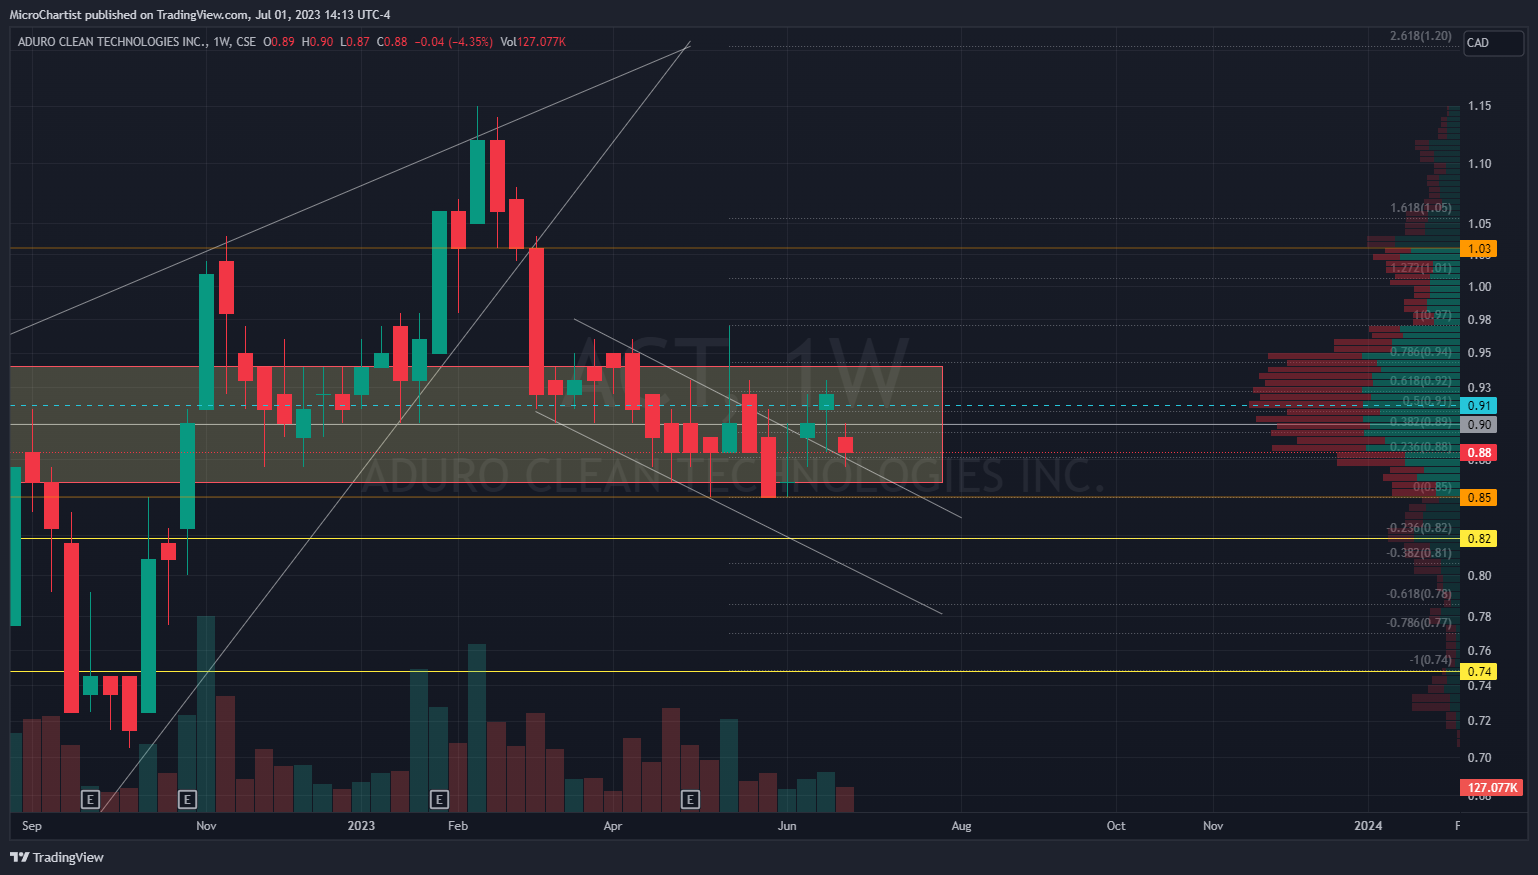
ACT has thus far seen 3 months of sideways movement, following the decline from its peak. Last month, I had spoken about a double bottom, that is no longer true and neither the bull nor bear case occurred as support at CAD $0.85 held, despite multiple retests. I believe that the price is likely to continue ranging around CAD $0.91 / $0.69 USD.
Bull Case: ACT had started forming a multi-week downward range but the price managed to close above it to close the month. Similarly to last month, the price needs to break above and hold CAD $0.90 / $0.67 USD to sustain a short term reversal. The price would then need to break above CAD $0.94 / $0.70 USD, for a chance at CAD $1.00 / $0.75 USD. A break of those levels can then give it a possibility of hitting recent highs at CAD $1.15 / $0.86 USD
Bear Case: The bear case of the last 2 months remains the same. The support at CAD $0.85 / ~$0.63 USD could be lost as that price continues to be retested. If it breaks, a likely floor could be at CAD $0.82 / $0.60 USD and if that breaks then I think the price may drop to CAD $0.77 / $0.58 USD. These prices coincide with the fib retracement levels and they also align with the chart’s historical prices.