
Behind the Charts: July's analysis, August's Forecast - Better late than never.
Technical Analysis for Pioneering Markets

Dear readers,
I’m back with another attempt to explain from an unbiased view, my technical analysis on the companies within the “Pioneering Markets” community. These are my personal opinions that I share for entertainment and educational purposes only.
In case you missed it, check out last month’s article for additional context on this edition 👇

Technical Analysis
1. PKK / PKKFF – Mean reversion and bottoming out?
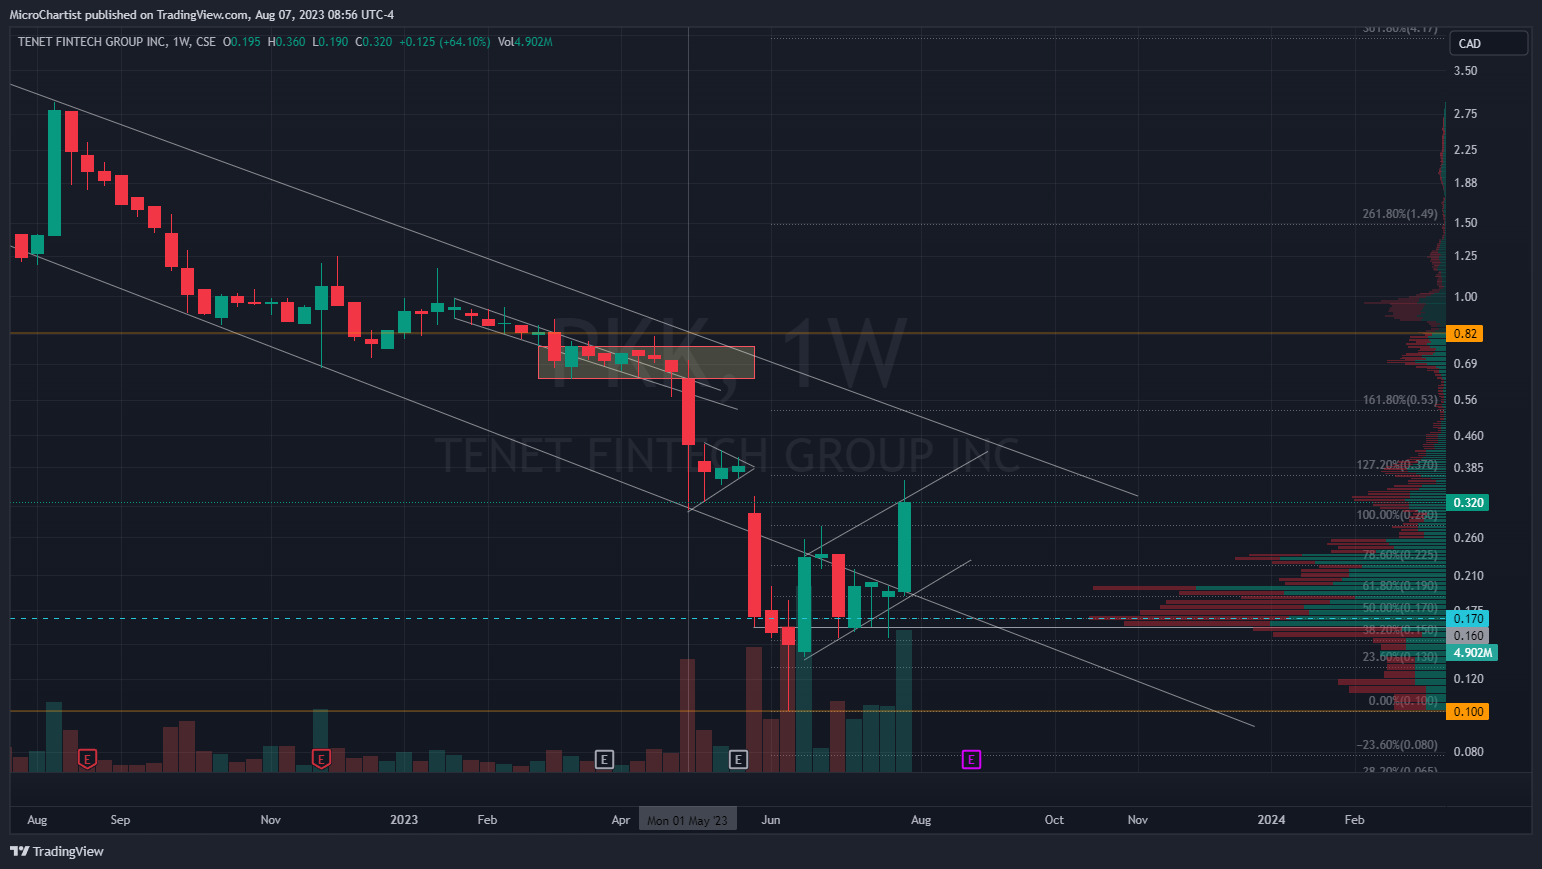
PKK / PKKFF Last Price CAD $0.32 / $0.2414 USD
PKK Closed the month of July 4% lower, but up 54% from the monthly low, and 130% from June’s low. The first week of August had another 40% gain, totaling 218% in gains in 2 months. As for my bull and bear case last month, I had mentioned a retest of CAD $0.15 / $0.11 USD which occurred, and a bull target of CAD $0.37 / $0.28 USD. August 2nd-3rd saw a high of CAD $0.36 / $0.2689 USD. All in all, shorter time frames are starting to become overbought, while high time frames remain oversold.
Bull Case: My secondary target from last month is still in play at about CAD $0.45 / $0.34 USD, this would coincide with the longer term downward trend line above the current price. I also have an upper price target of CAD ~$0.53 / $0.40 USD.
Bear Case: PKK loses momentum and retraces to CAD ~$0.23 / ~$0.17 USD. This would be an important level to watch. A break of this level would imply that PKK will either retest lows or it will remain within a lower-bound range around CAD $0.16 / $0.12 USD.
2. AMPD / AMPDF – Barcoding and Flatlining.
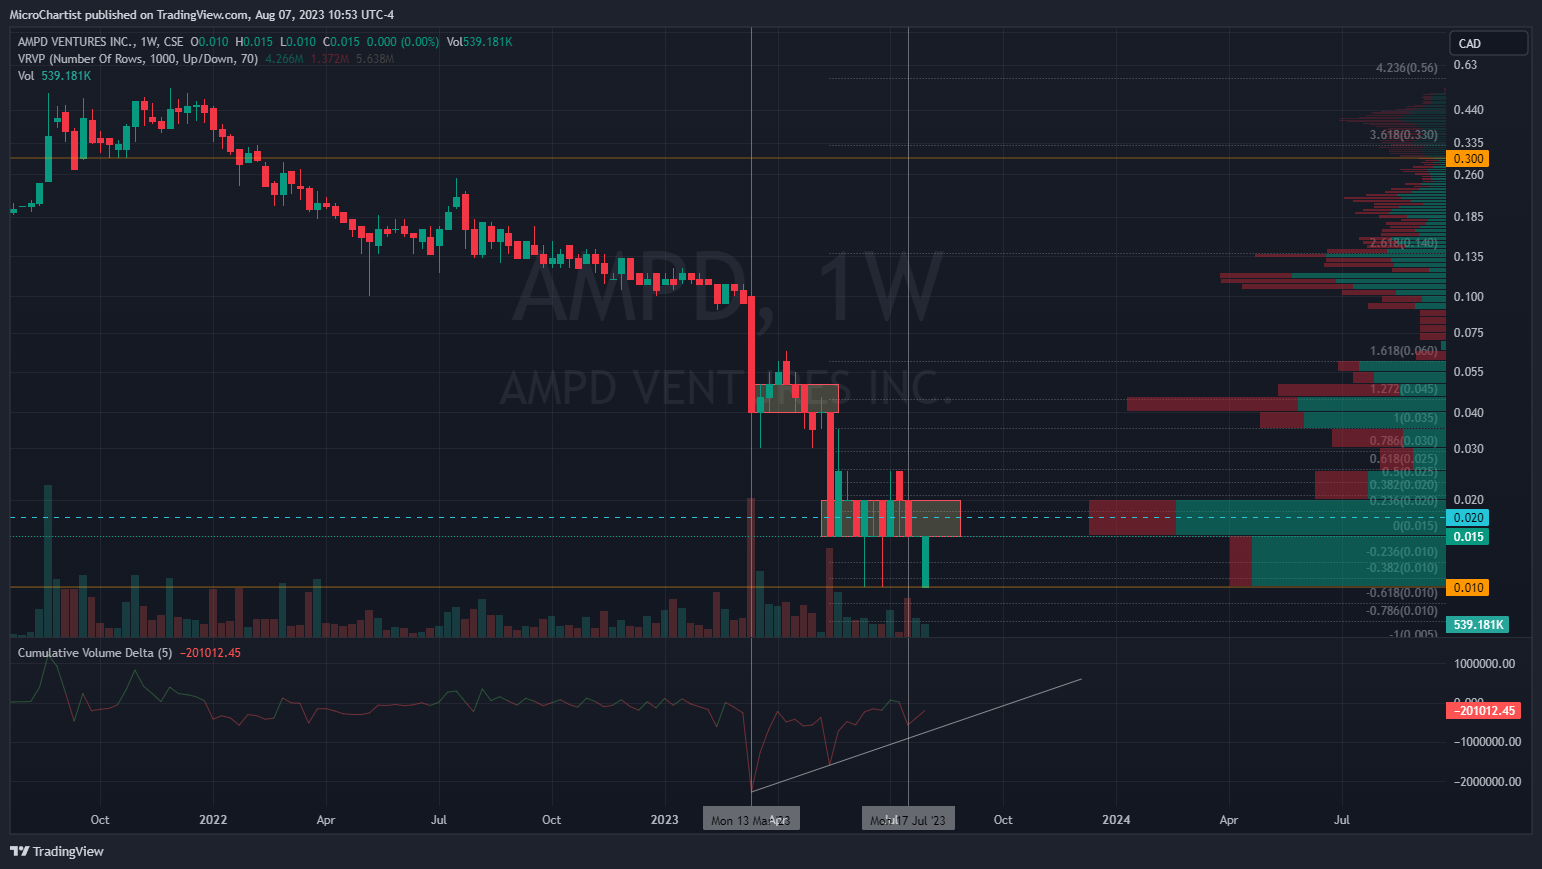
AMPD/AMPDF Last price: $CAD 0.015 / $0.0108 USD
Fortunately or unfortunately not much has changed here, with price remaining flat on the month and equal lows. It even had a 0% change week on the CSE with almost 850K shares traded. That being said, my analysis from last month remains exactly the same.
Bull Case: There isn’t much to be bullish about, but there is a silver lining: Heavy accumulation can be seen from CAD $0.01 - $0.015 through the volume profile and the bullish divergence within the oscillator. The green bars on the right of the image indicate heavy buying, compared to the smaller red bars in the Volume Profile. This implies limited selling at specific prices. As for the oscillator, look for the 2 grey vertical lines connecting the chart to the oscillator. The lines are meant to emphasize the rising oscillator, despite the declining stock price. This is bullish divergence and it implies accumulation. That being said, the price would need to close at CAD $0.02 and eventually sustain a price of CAD $0.025 to make a higher high and increase the chances of continued bullishness.
Bear Case: Bearishness is the dominant trend. The price may start ranging at a lower level between CAD $0.01 - $0.015 with a potential for new lows at CAD $0.005.
3. PBX / PWWBF – Rangebound
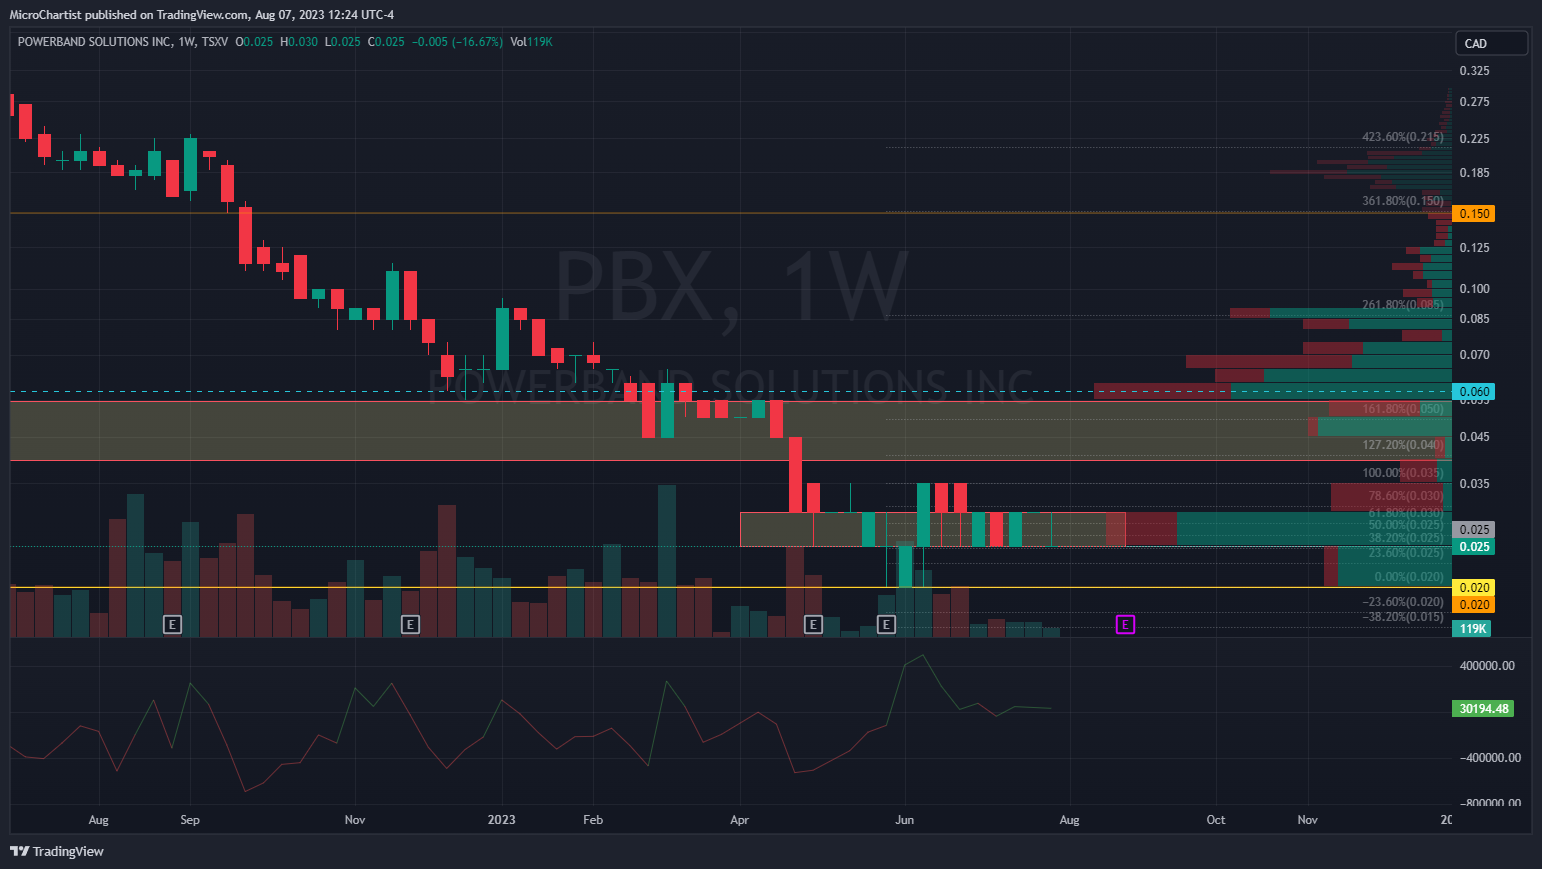
PBX/PWWBF Last price: CAD $0.025 / $0.019 USD
Similarly to AMPD, there’s not much to see here. PBX managed to close the month down almost 17% and yet remained within the box that was identified months ago. As such, my forecast remains mostly the same, with only minor changes to account for the half penny difference.
Bull Case: PBX breaks above the lower box at CAD $0.03 /$0.022 USD climbs before retesting resistance at CAD $0.04/$0.03 USD for a chance of breaking above the upper box/historic range around CAD $0.06 / $0.045 USD. This could then signal the start of a potential trend reversal.
Bear Case: Bearishness is the dominant trend and there’s heavy selling that can be seen in the Volume Profile at CAD $0.03 - $0.04. This likely means that the buyers at CAD $0.02 - $0.025 are flipping their shares for 60% - 100% gains. Because of this, a new range may begin from CAD $0.02 - $0.04, with eventual dips to new lows at CAD $0.015.
4. AUAG / AUXIF – New 52w lows & a bounce
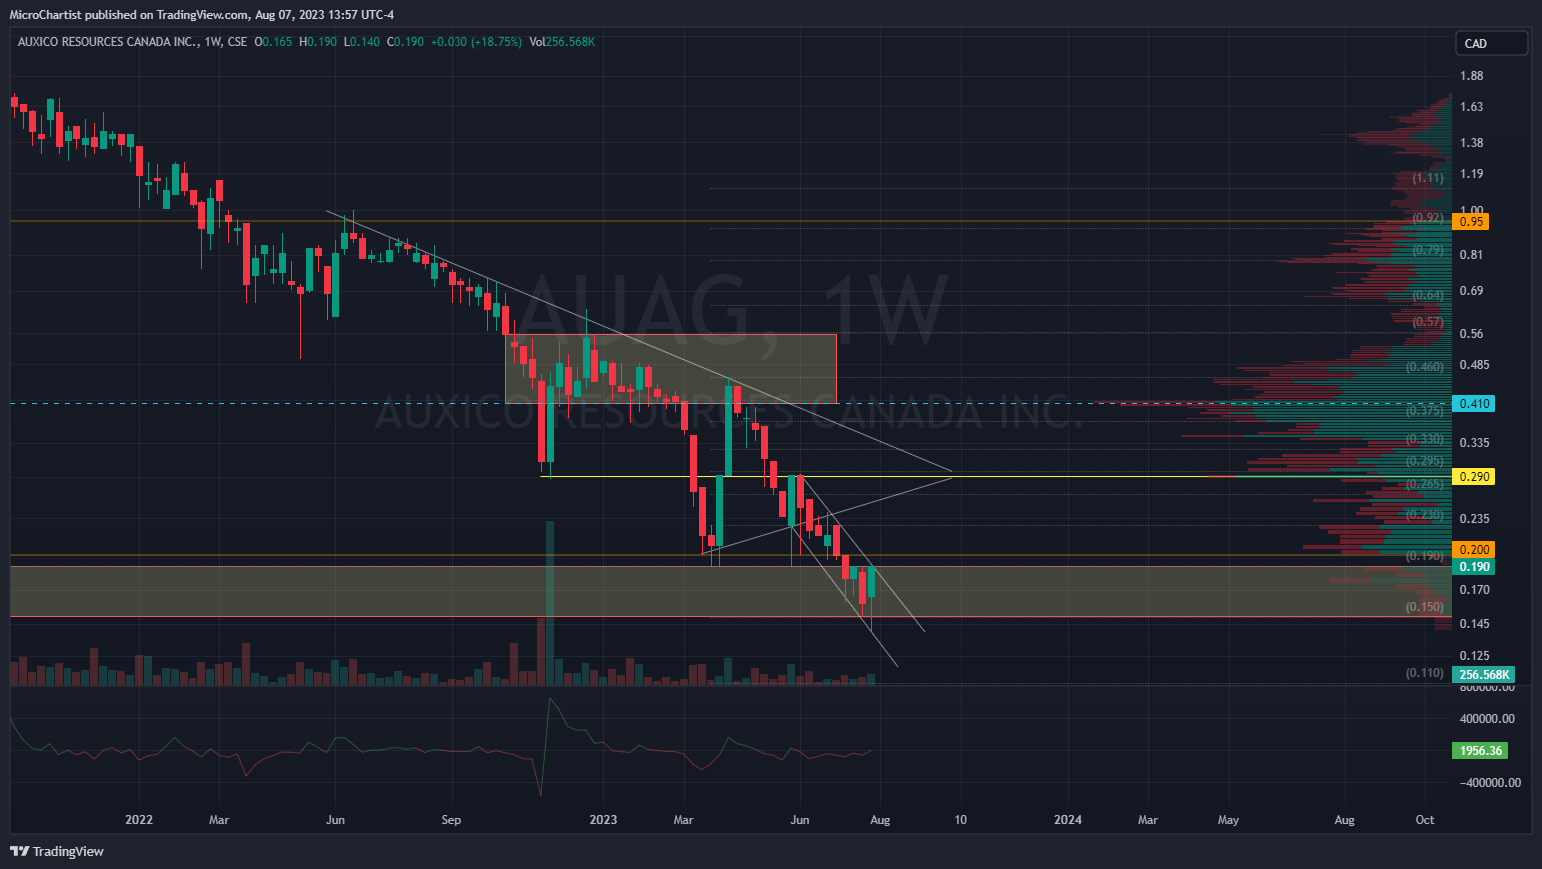
AUAG/AUXIF Last price: CAD $0.19 / $0.175 USD
July began with a rejection of the triangle followed by a continued decline into the identified zone and new 52 week lows. The price declined 15% intraday on July 31st, before closing flat. The price has since climbed 36% from that low over 4 days.
Bull Case: I had mentioned last month that new lows in this case could lead to a bear trap and that may very well be playing out with the recent gains. If that’s the case I’d look for the price to retest resistance at CAD $0.29 / $0.22 USD (Yellow line). A break of that level could then take the price to CAD $0.41 / $0.31 USD (Dotted line).
Bear Case: Price fails to make a meaningful break above CAD $0.19 / $0.175 USD and ranges within the identified zone around CAD $0.14 - $0.19 / $0.10 - 0.175 USD. Lower lows could then be possible to about CAD $0.10 - $0.11 / $0.075 - $0.082 USD.
5. FOBI / FOBIF – Higher lows and consolidation
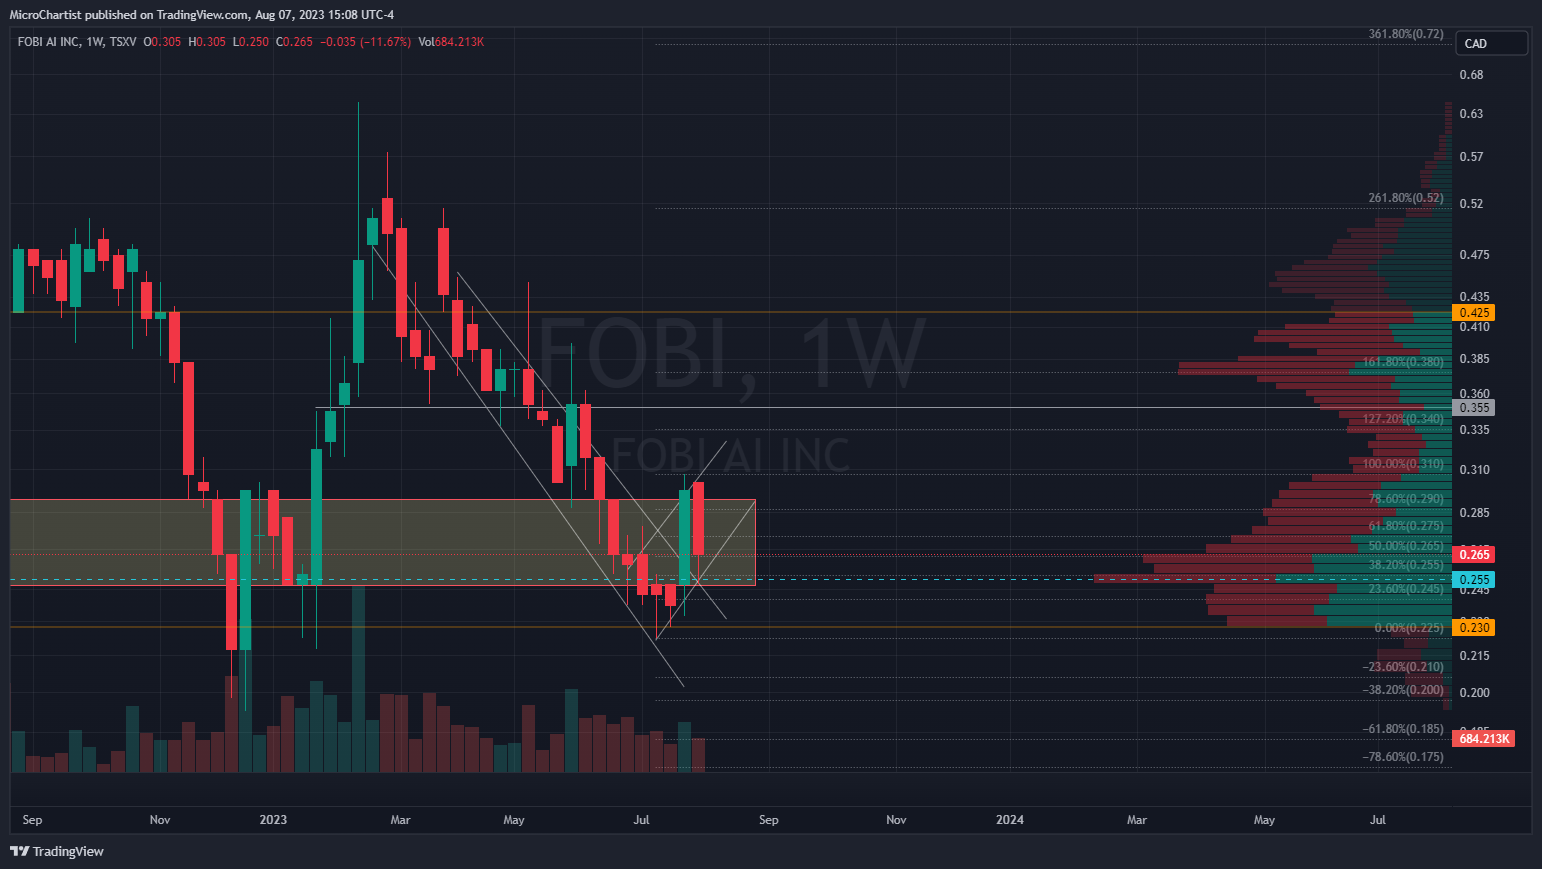
FOBI/FOBIF Last price: CAD $0.265 / $0.20 USD
FOBI broke below the yellow box as I forecasted it would, but it was able to sustain a higher low. The price then broke above CAD $0.30 / $0.23 USD as I called for in my bull case, but then also failed to make higher highs. It then proceeded to give back it’s gains and moved back to June’s closing price.
Bull Case: FOBI has had 4 consecutive weeks of higher lows and is currently sitting at the 50% fib retracement level after the recent run-up. If this level holds, I expect the price to break back above CAD $0.30 / $0.23 USD and make higher highs to about CAD $0.35
Bear Case: Support breaks at CAD $0.25 / $0.19 USD. A new range may then begin between CAD ~$0.20 - $0.25 / $0.15 - $0.19 USD. The price may then retest 52 week lows at CAD $0.195 / $0.1439 USD.
6. LNBK / LBNKF – Bull flag invalidated
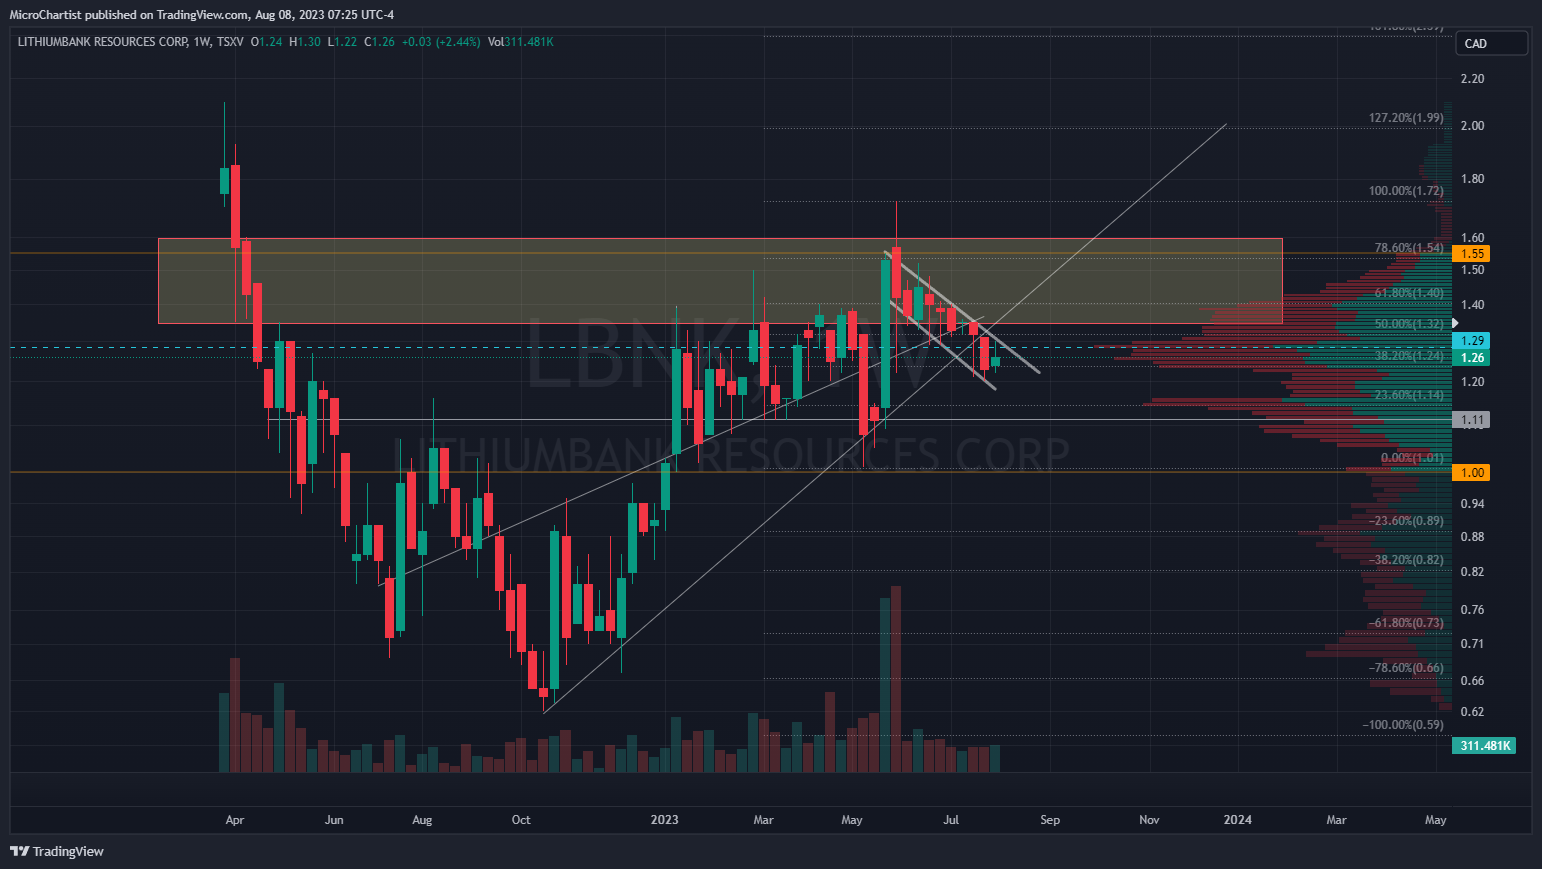
LBNK/LBNKF Last price: CAD $1.38 / $1.04 USD
LBNK broke below the yellow box at the start of the month and failed to move through it again. This led to an extended downward range and an invalidation of the bullish flag that I had mentioned last month. All in all, price was down about 8% with the low of the month having hit my bear case for July. This month, I think that LBNK will continue to grind sideways around CAD $1.30 / $0.96 USD.
Bull Case: LBNK continues making higher lows and retests resistance at CAD $1.35 / $1.00 USD. If it can break through that point then it will likely make it back above CAD $1.60 / $1.19 USD, as there shouldn’t be much resistance around those prices. Otherwise, I still believe this can get close to previous all time highs around CAD $1.85 / $1.37 USD
Bear Case: The downward range continues and LBNK retraces to CAD $1.10 / $0,82 USD. A loss of support around that level could then bring the price to CAD $1.00 / $0.74 USD
7. VSBY/VSBGF - All Time Lows & Capitulation.
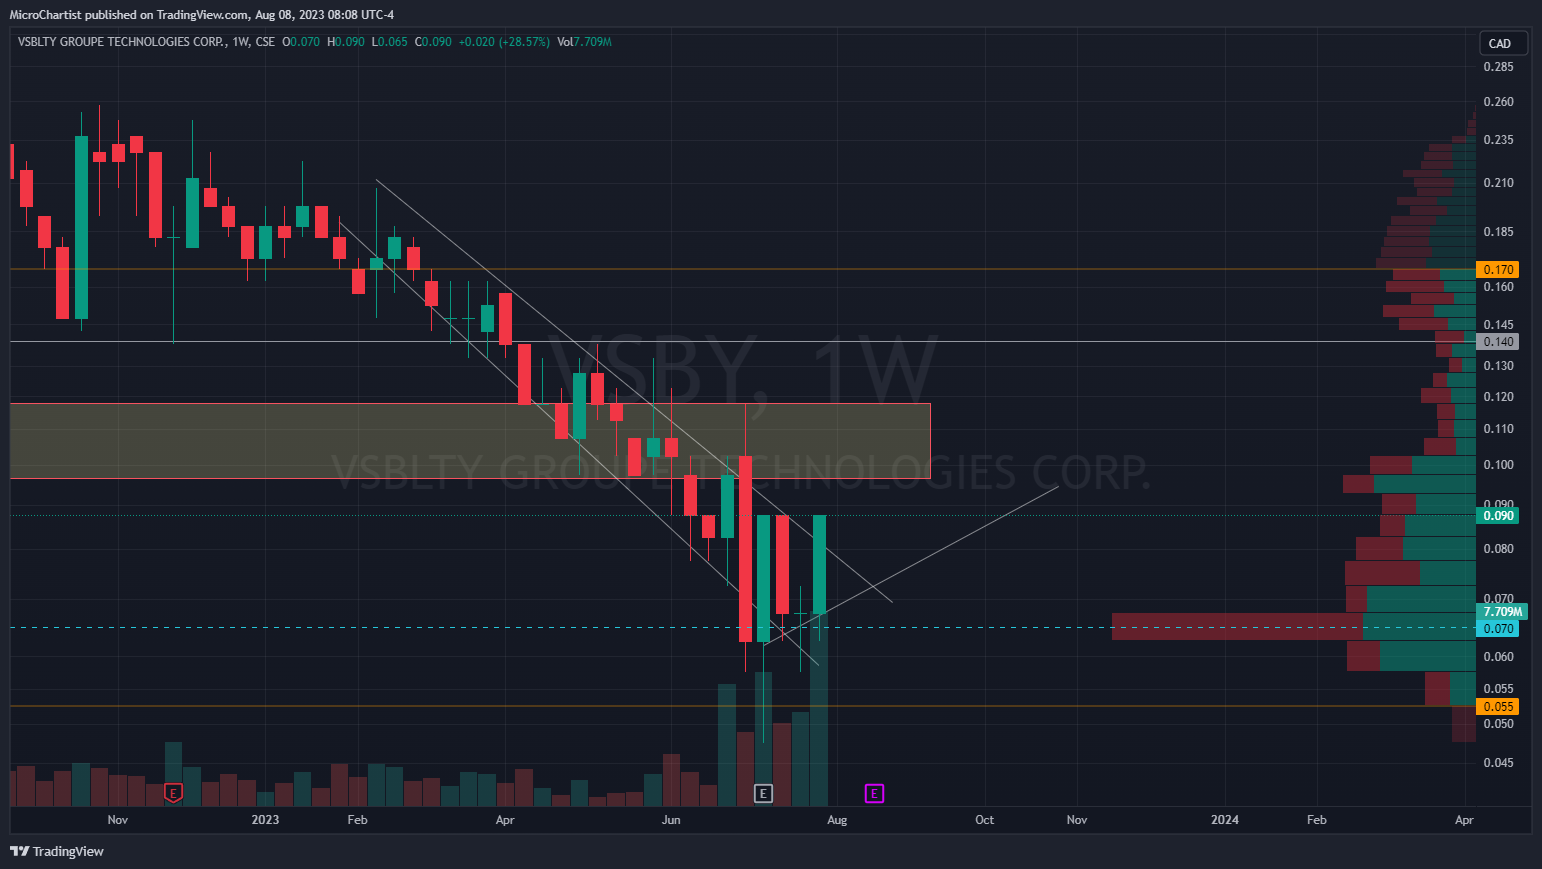
VSBY/VSBGF Last price: CAD $0.09 / $0.0528 USD
While VSBY didn’t hit my bull target, it still managed to claw back 80% from it’s July lows and closed out the month 38% higher. This came after some big selling, as can be seen in the volume profile indicator.
Bull Case: Price will need to break above resistance at CAD $0.10 / 0.074 USD for a chance to get to CAD $0.12 / $0.09 USD which is the top of box, and a weekly resistance level.
Bear Case: Similar to last month, the dominant trend is still bearish, and I believe that a new range may form between CAD $0.065 - $0.085 / $0.048 - $0.064 USD. Otherwise, it may test support around CAD $0.06 / $0.044 USD for a chance at equal or new lows.
8. FANS / FUNFF – New lows
FANS/FUNFF Last price: CAD $0.045 / $0.033 USD
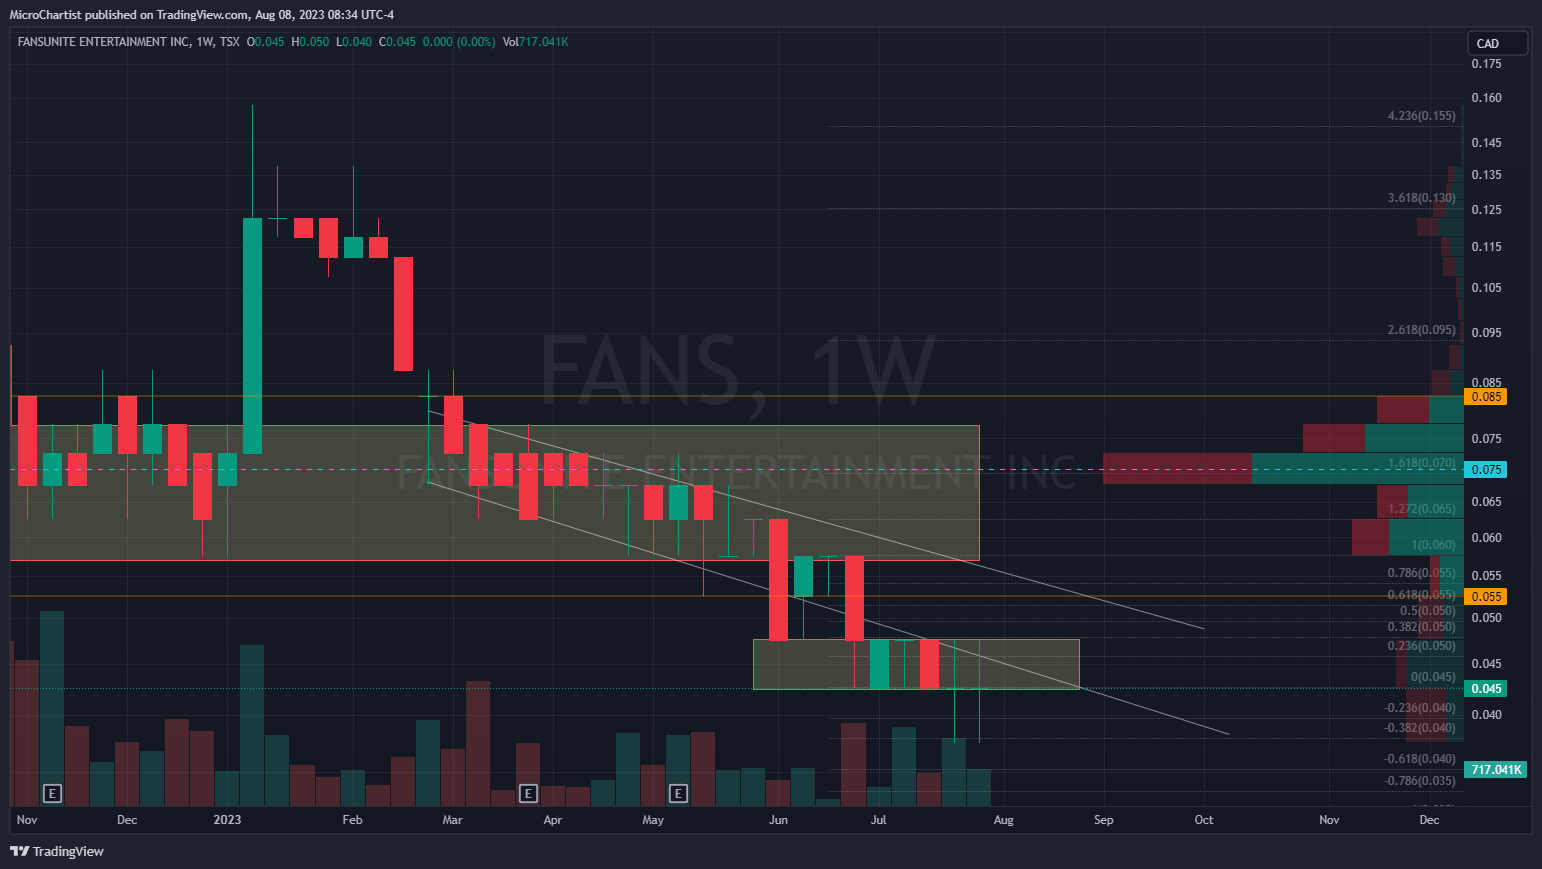
FANS mostly ranged for the month but managed to make new lows at CAD $0.04 / $0.03 USD. That being said, neither my bull nor bear cases were hit last month so I’m maintaining both of them.
Bull Case: There’s a chance for a larger move to CAD $0.075 / $0.057 USD, as this is where the historic point of control is. In other words, it’s the level at which the most volume has traded. Price has a tendency to range around that level.
Bear Case: Bearishness is the dominant trend. Implying, that FANS is likely to retest and make new lows. The price may fall to CAD $0.035 / $0.026 USD
9. ACT / ACTHF – Breakout into Retracement
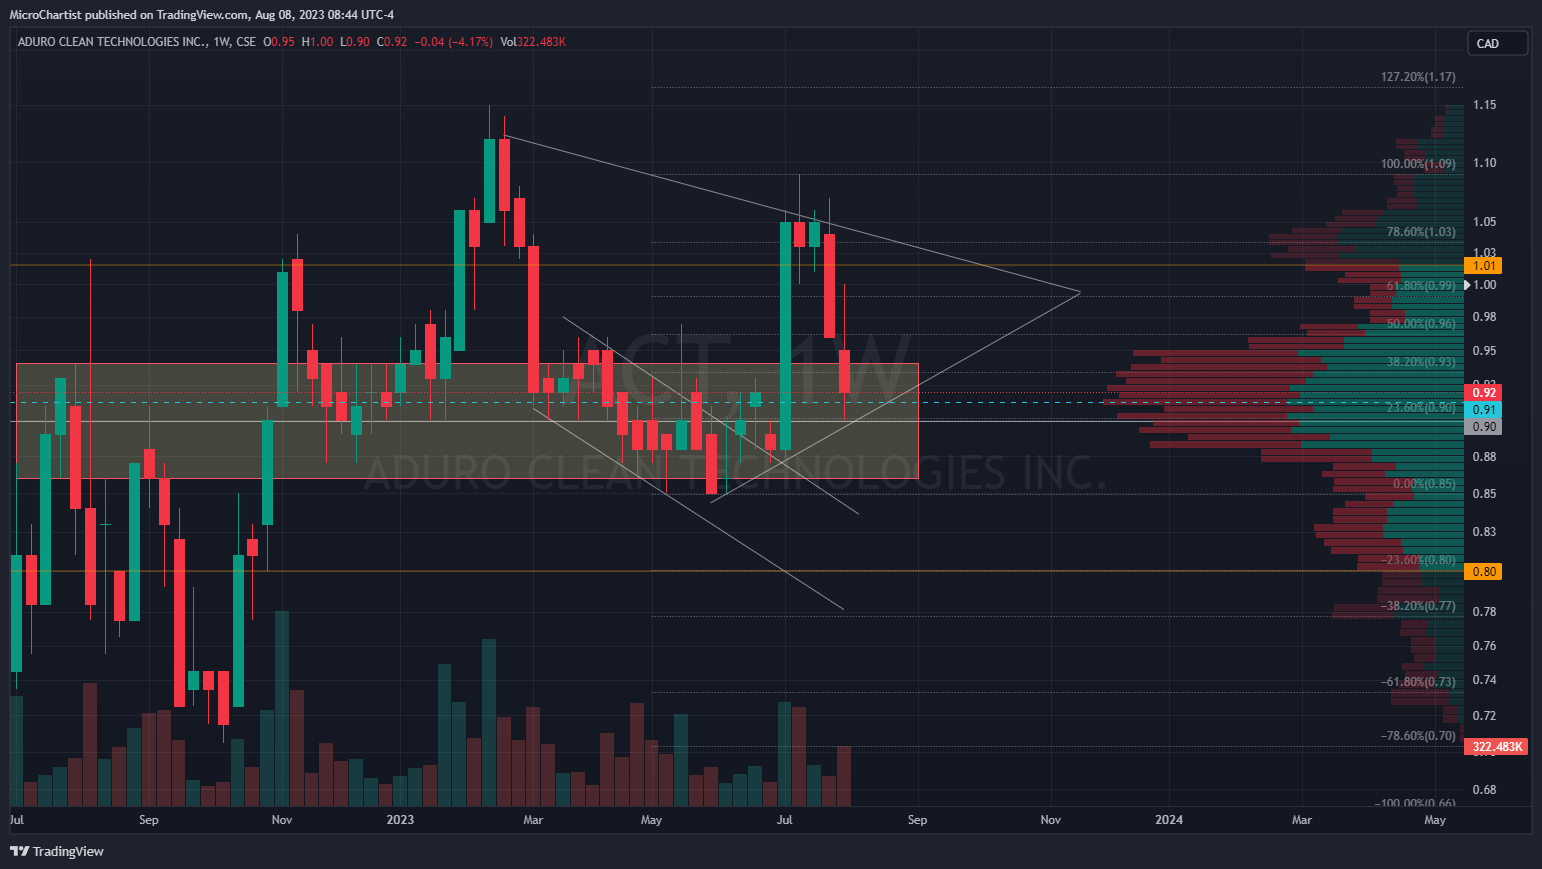
ACT/ACTHF last price: CAD $0.92 / $0.67 USD
After 3 months of sideways movement ACT showed signs of bullishness with a 20% breakout. The price then retraced the majority of its move forming a symmetrical triangle pattern.
Bull Case: Support holds against the bottom trend line of the triangle and price continues to consolidate within each line. The triangle will need time to play out, so I believe a breakout would only occur towards the end of August, and likely only complete into September. That being said, the measured move of the breakout has a target of CAD $1.30 / $0.96 USD, which also coincides with Aduro’s all-time high.
Bear Case: The triangle breaks to the downside. Support at CAD $0.85 / ~$0.63 USD is then likely to be retested. A break of that level could have the price fall into the CAD $~0.70s / $~0.50s USD.