

Dear readers,
I’m back with another monthly letter in which I’ll attempt to explain from an unbiased view, my technical analysis on the companies that “Pioneering Markets” follows. These are my personal opinions that I share for entertainment and educational purposes.
And in case you missed it, check out my previous letter as it may provide additional context for this month’s edition:

Technical Analysis
1. PKK / PKKFF – Bullish retests ending with new 52w lows
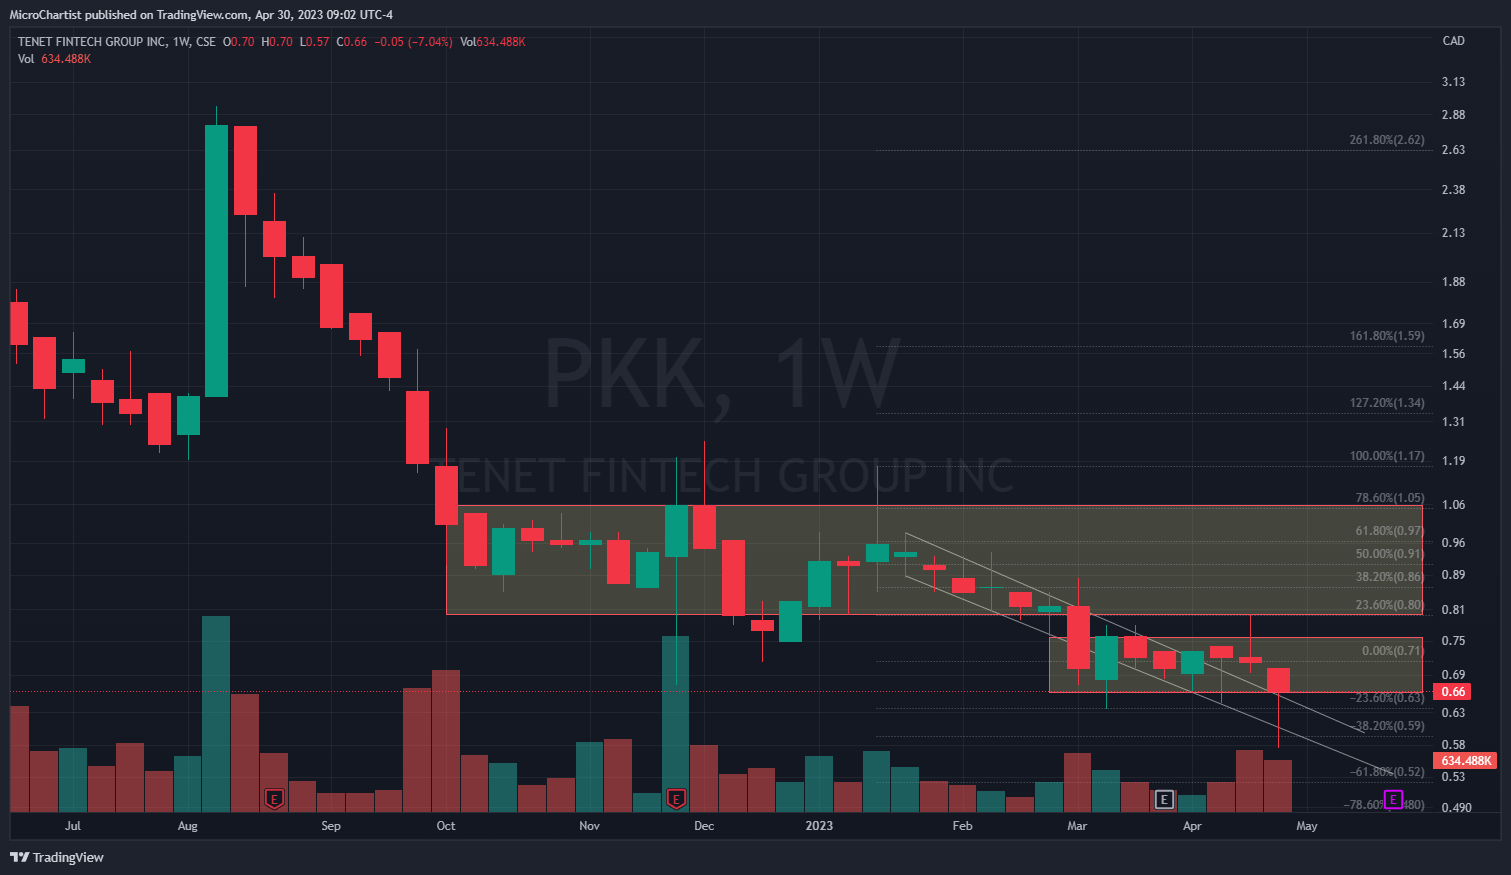
PKK / PKKFF Monthly Closing Price $CAD 0.66 / $0.4921 USD
PKK achieved both of my bull and bear cases that I had written about at the start of the month. A break above CAD $0.72 /~$0.55 USD into resistance before falling back into new 52w lows at CAD ~0.58ish/~0.42 USD. This being said, the dominant trend remains bearish.
Bull Case: PKK once again needs to break above CAD $0.73 / ~$0.56 USD for another chance at Resistance at CAD $0.80 / ~$0.60 USD. If the price can break through that wall it may then have a chance of hitting CAD $1.00 / $0.74 USD
Bear Case: There’s a chance that PKK makes new 52W lows once again in May at around CAD $0.50 / ~$0.40 USD. I used the Fibonacci retracement levels and historical price structure to get to this level. Otherwise, a very volatile downward move may also have this go even lower to CAD $0.30 - $0.40 / USD ~$0.20 - $0.25
2. AMPD / AMPDF – Volatile Ranges.
AMPD/AMPDF Monthly closing price: $CAD 0.04 / $0.03 USD
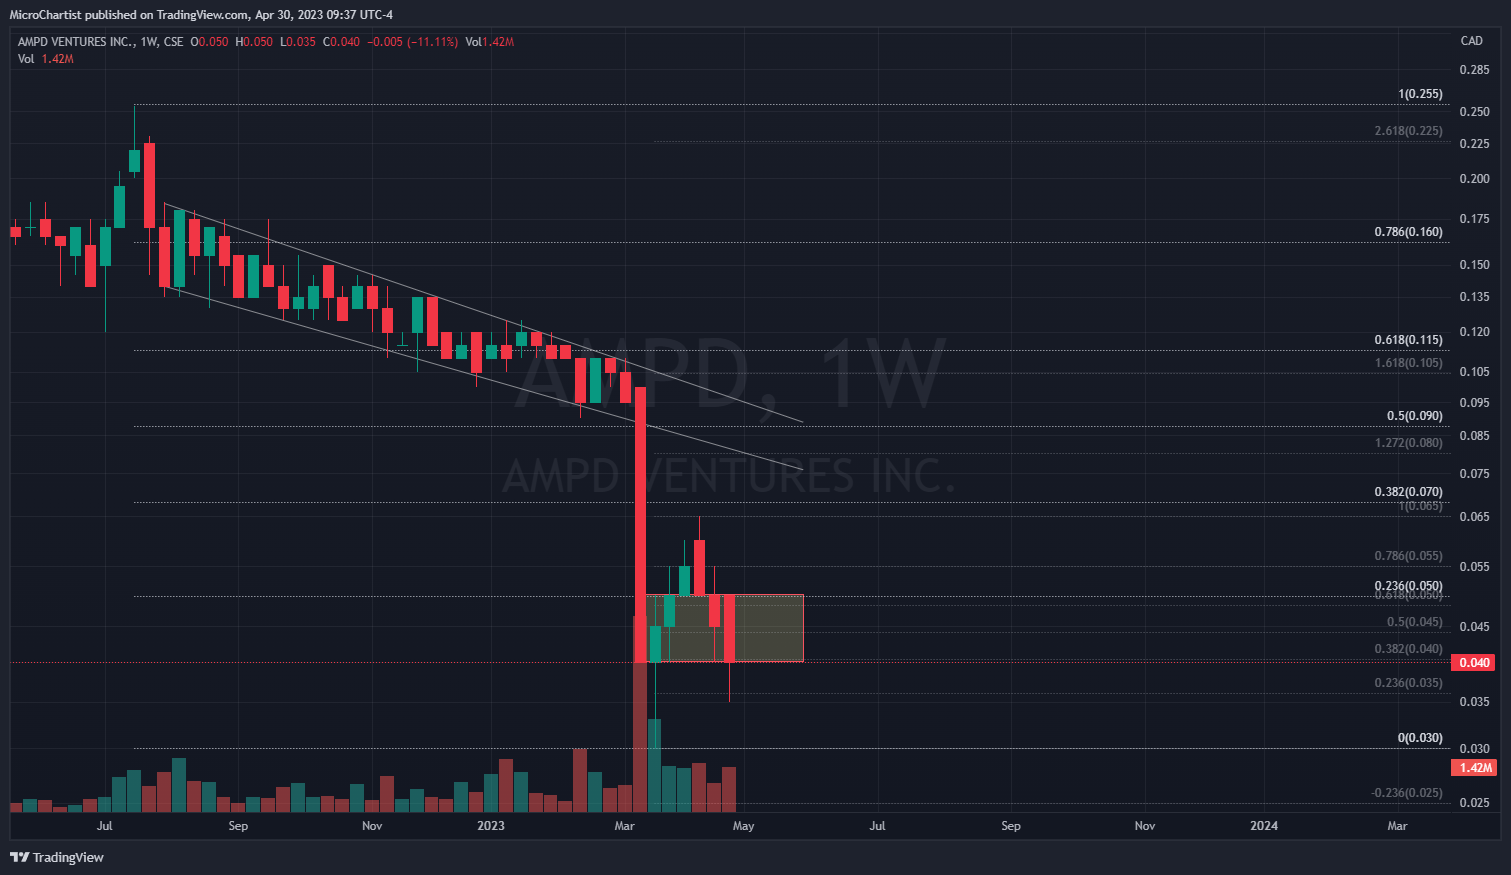
AMPD climbed over 116% from the bottom in April before retracing 40% lower, at the bottom of the range that was identified at the start of the month. I still believe that AMPD is likely to range within that box, with periods of higher volatility on either end of it.
Bull Case: It looks like AMPD will either make it back to it’s 52w lows at CAD $0.03 / $0.259 USD to print a double bottom, before climbing back up. Or perhaps make a higher low at CAD $0.035 / $ 0.0275 before retesting the highs of the recent bounce at CAD $0.065 / $0.0429 USD. This would equal another 100% or more gain.
Bear Case: The bear case is technically more likely to occur as it is the dominant trend. This would likely mean new 52W lows at $0.02 - 0.025.
3. PBX / PWWBF – Historic lows.
PBX/PWWBF Monthly closing price: $CAD 0.03 / $0.0255 USD
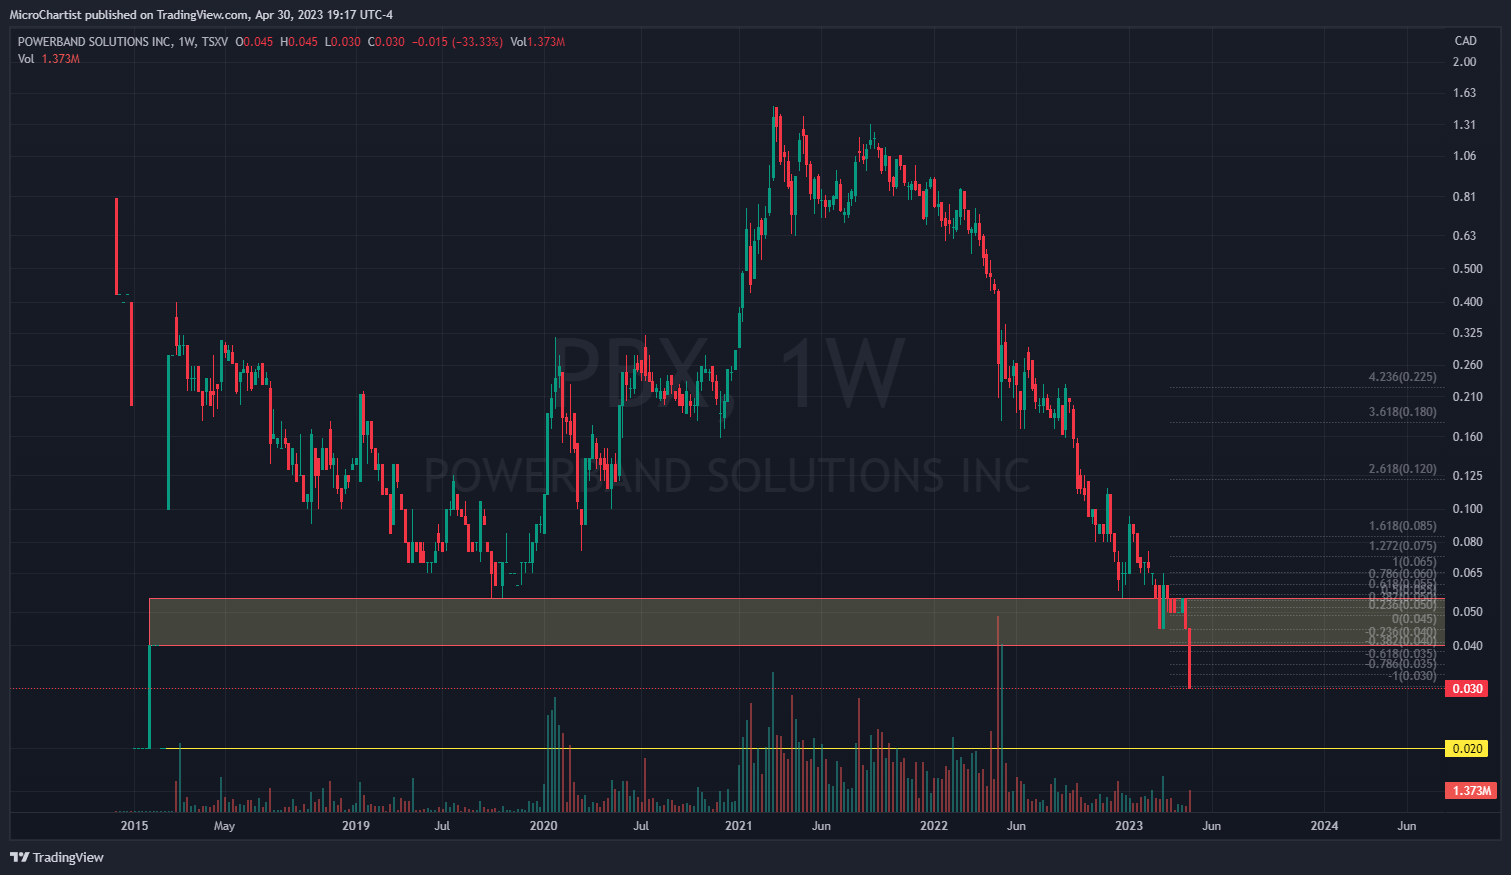
I had rightly called that the price would go down but I had incorrectly forecasted by how much. I was thinking another 20% lower, but instead it doubled down 40%.
Bull Case: The floor gets set at CAD $0.03 / $0.0255 USD and the price retraces some of it’s recent losses to CAD $0.04 - $0.05 / ~$0.03 - $0.04 USD.
Bear Case: 52w lows usually mean more lows to come. The next logical downside price target would then be CAD $0.02 / ~$0.015 USD to PBX’s 2016 opening price and another ~33% drop.
4. AUAG / AUXIF – Complete retracement of measured move and consolidation.
AUAG/AUXIF Monthly closing price: $CAD 0.38 / $0.29 USD
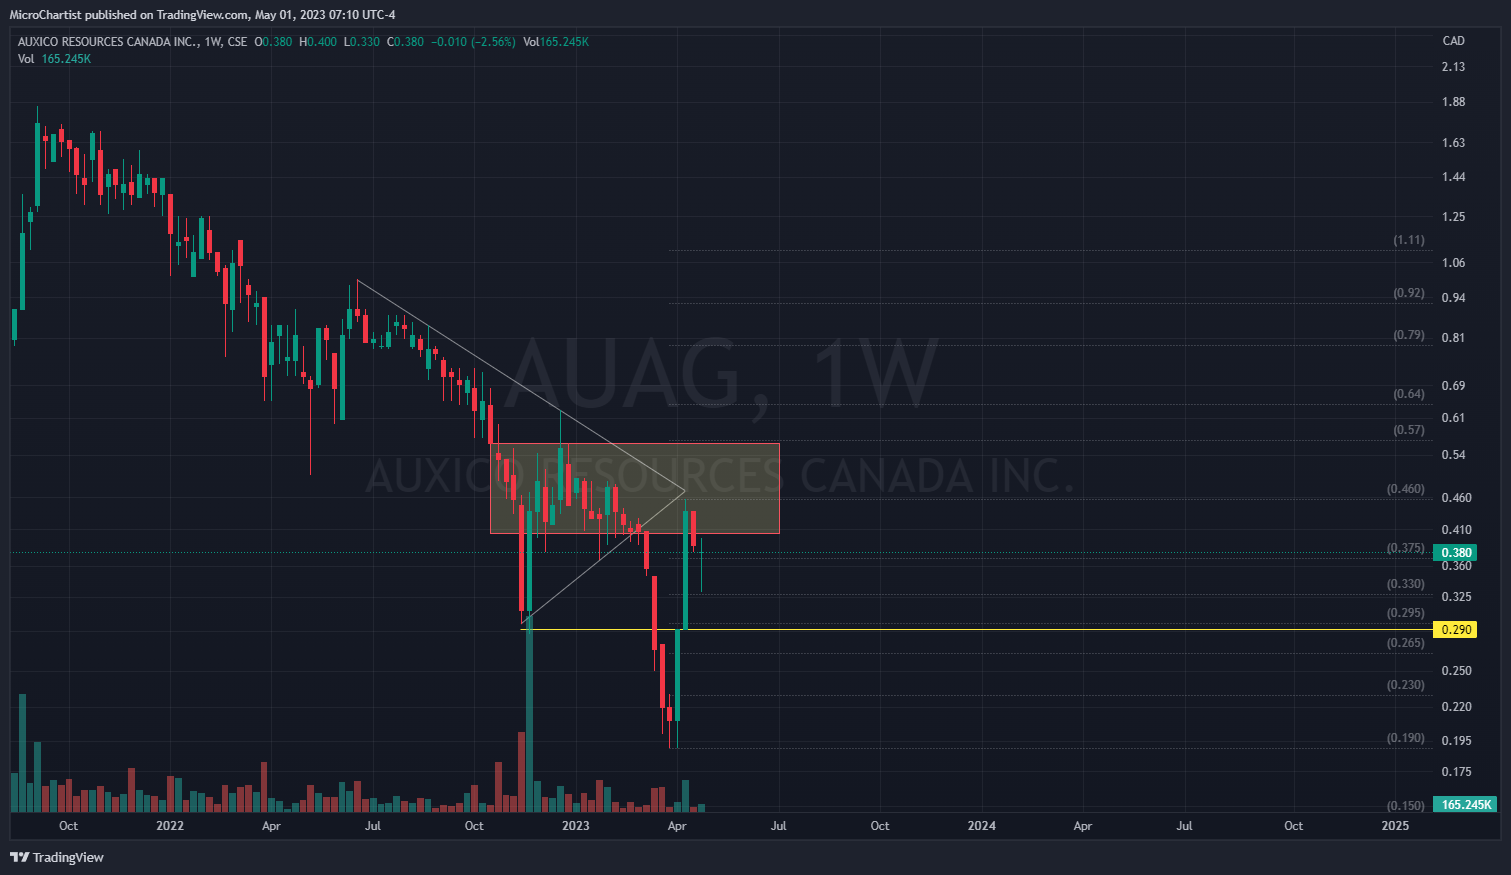
Auxico bottomed at CAD $0.19 / $0.16 USD and had a monthly high of CAD $0.46 / USD $0.3325. I accurately called the initial move in last month’s letter and then a 2nd move on Twitter. The price then continued even higher before consolidating.
Bull Case: If AUAG can reclaim it’s recent highs it should then be able break back above CAD $0.56 / $~0.41 USD, which is the top of the box pictured above. If the price can break that resistance I can also see it hitting CAD $0.64 / $0.505 USD which is the previous high within the triangle. Both of these prices coincide with the Fibonacci levels.
Bear Case: AUAG makes lower lows and tests support at CAD $0.29 / $~0.21 USD before breaking lower.
5. FOBI / FOBIF – Retracing and reversal?
FOBI/FOBIF Monthly closing price: $CAD 0.38 / $0.2811 USD
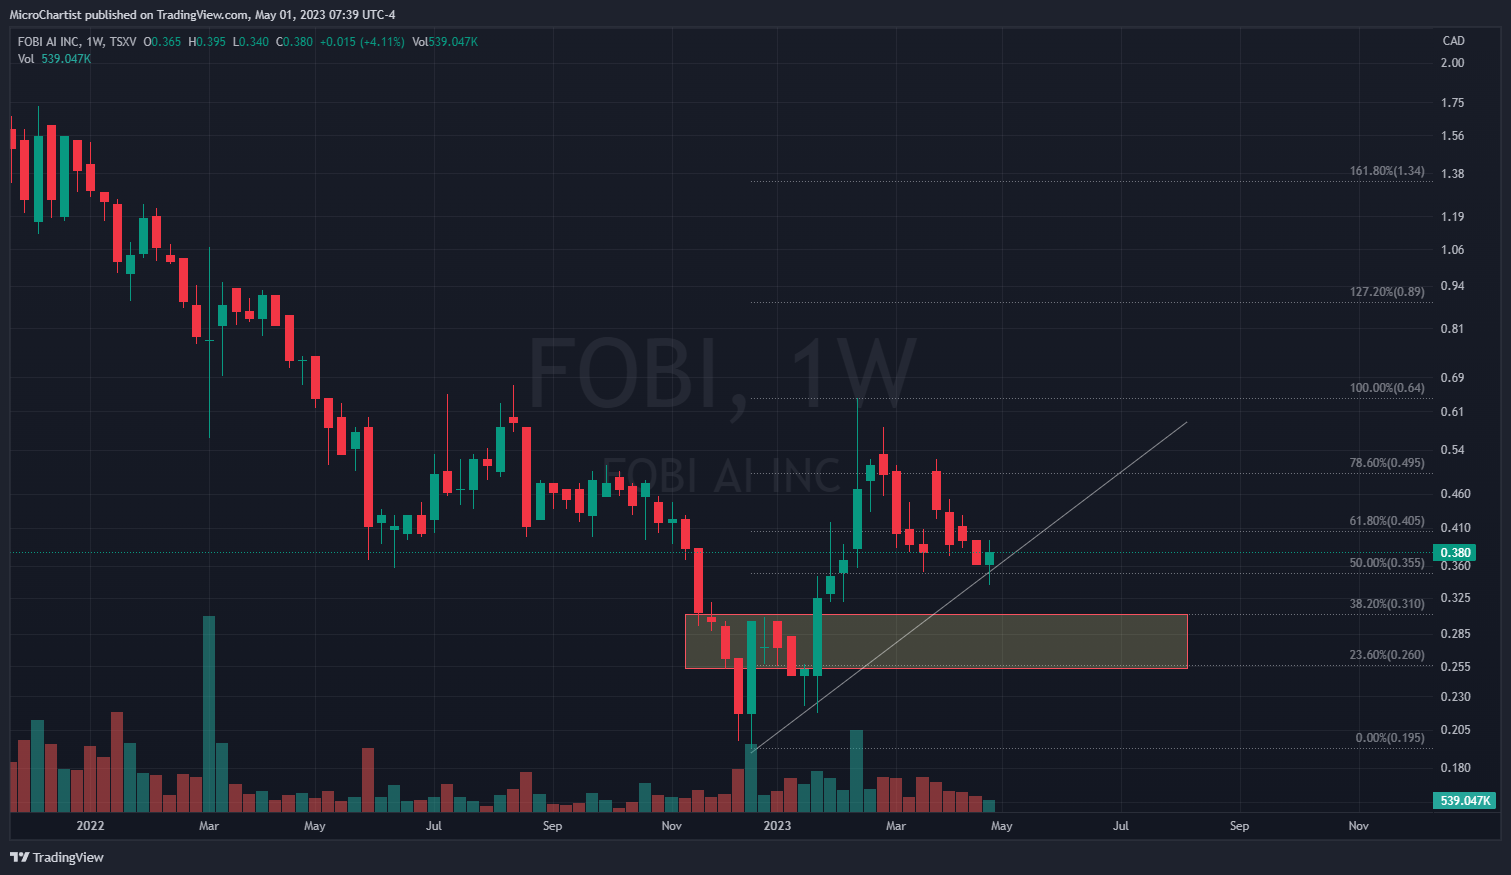
Last month’s bear case played out as FOBI broke below CAD $0.39 / $0.2873 USD and the price tested the 50% fib. retracement level at CAD $0.35 / $0.2611 USD. Bearishness remains the dominant trend.
Bull Case: Support holds around CAD $0.35 / $0.2611 USD and FOBI is able to sustain a price above CAD$0.50 / $~0.37 USD eventually pushing for higher highs above $CAD 0.65 / $0.48 USD
Bear Case: Support breaks around CAD $0.35 / $0.2611 USD and FOBI drops to the box that’s identified between CAD $ 0.25 - $0.31 / $0.1841 - $0.2283 USD. These prices also coincide with Fib. levels
6. LNBK / LBNKF – Testing recent highs
LBNK/LBNKF Monthly closing price: $CAD 1.39 / $ 0.9585 USD
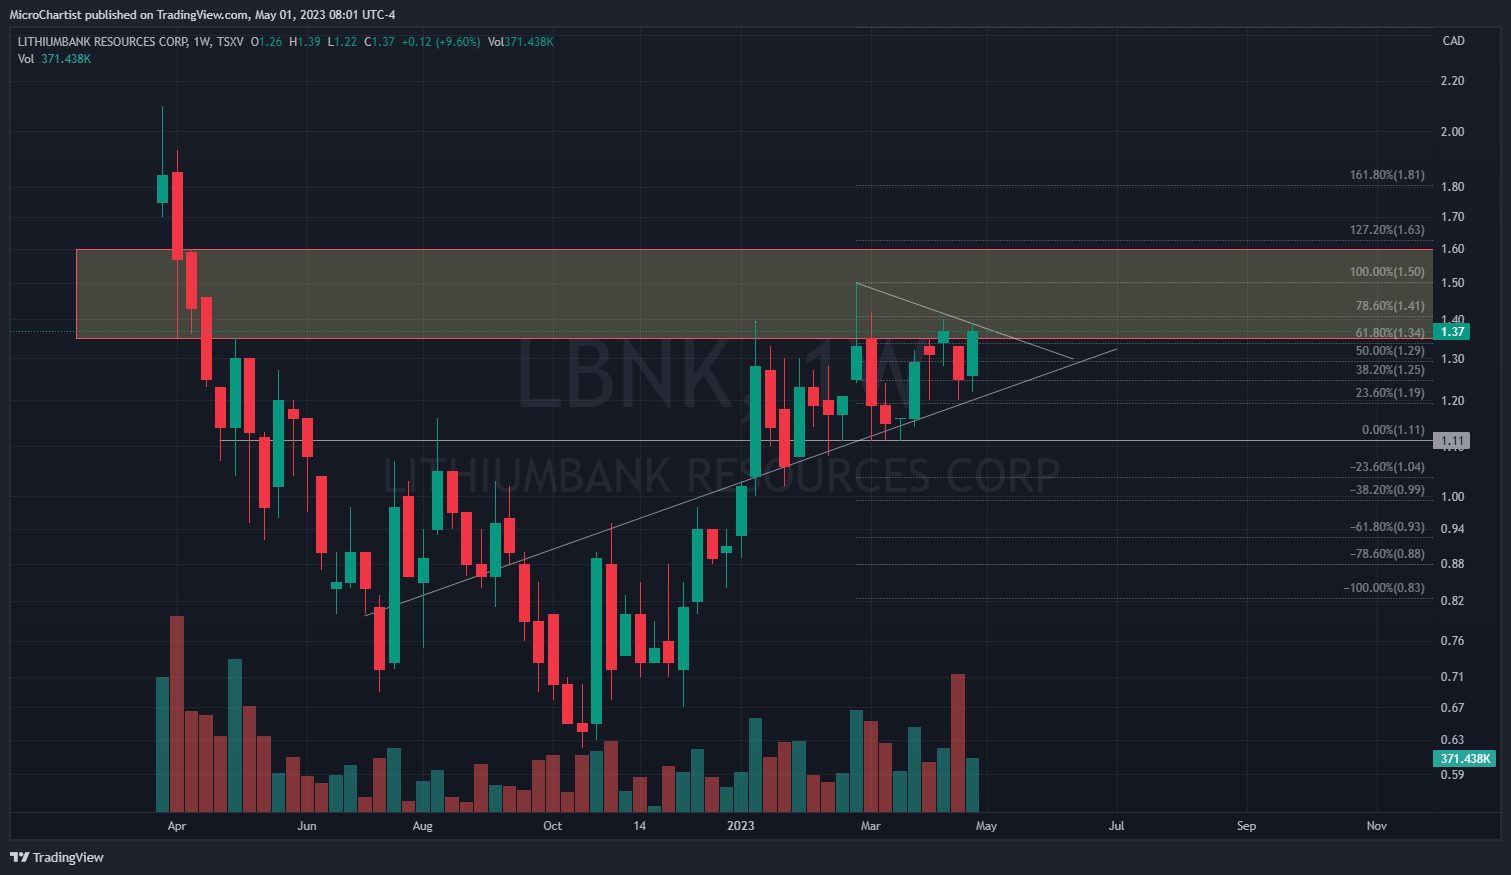
April was an upward consolidation period for LBNK, implying that the price was able to strengthen it’s base while gaining in price.
Bull Case: A measured breakout from the triangle would have the price go to around CAD $1.81 / $1.33 USD. This also coincides with the highest fib level. I think that this is the more likely outcome of the 2 cases.
Bear Case: The breakout occurs to the downside and tests support at CAD $1.11. / $0.82 USD. If that support breaks the price may have a chance of breaking below CAD $1 / $0.74 USD.
7. VSBY / VSBGF – Continuation of downtrend & 52w lows
VSBY / VSBGF Monthly closing price: $CAD 0.11 / $0.832
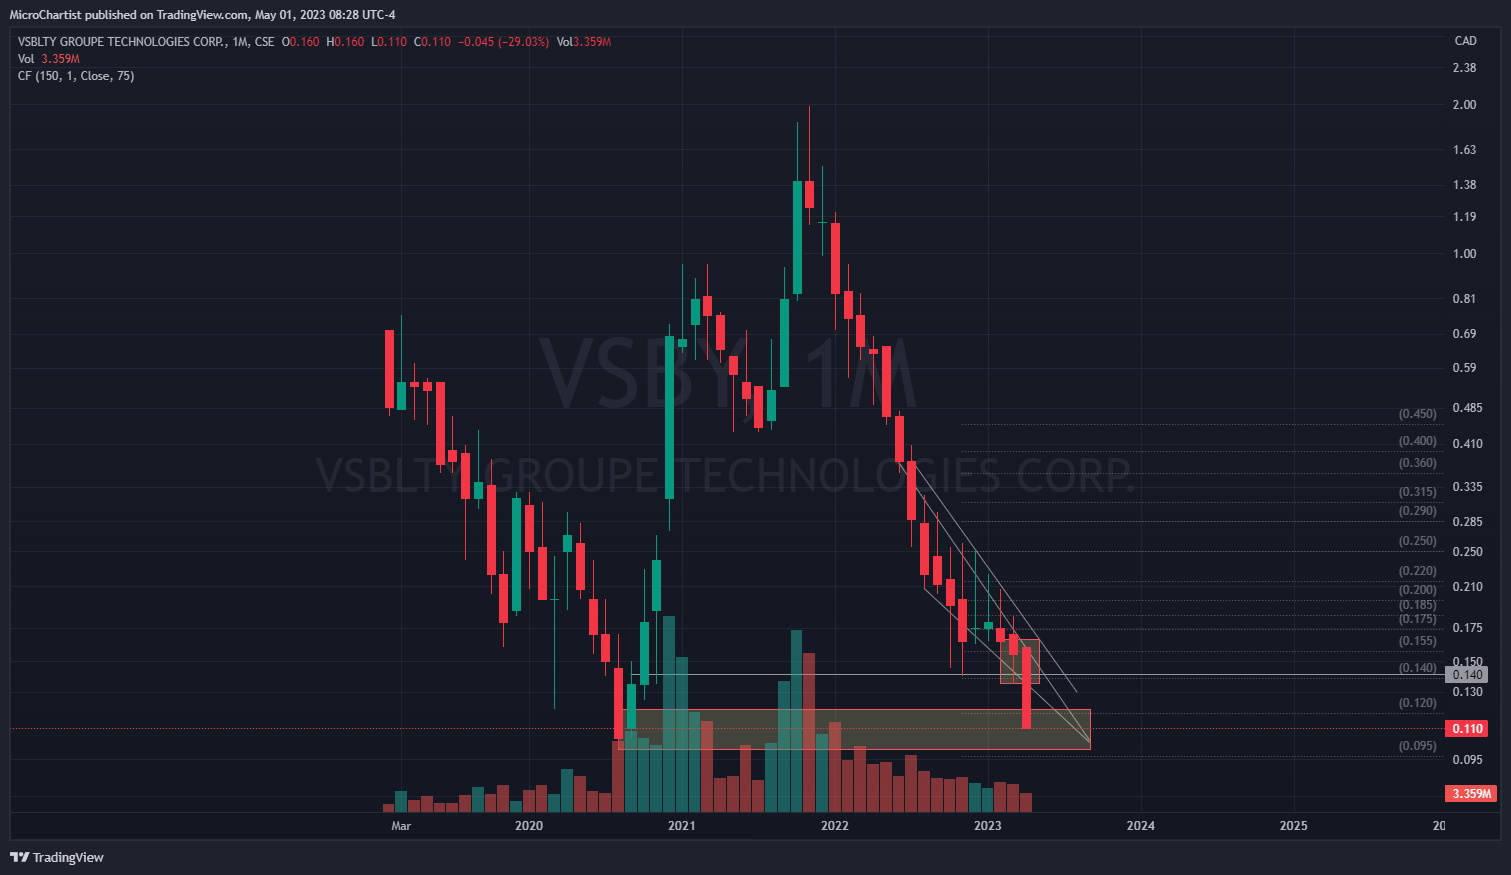
The bear case played out over the last month with a break below the wedge and into the range that was identified.
Bull Case: The downward pressure subsides and VSBY is able to create a base from which to bounce from. Otherwise there is a possibility of mean reversion for a ~40% gain as the price is incredibly oversold. This move would have VSBY back at it’s VWAP (Volume weighted average price)
Bear Case: VSBY breaks below the identified range to make all time lows around the next fib. levels between CAD $0.09 - $0.095 / $0.066 - $0.07 USD.
8. FANS / FUNFF – Ranging with a bearish bias.
FANS/FUNFF Monthly closing price: CAD $0.07/ $0.523
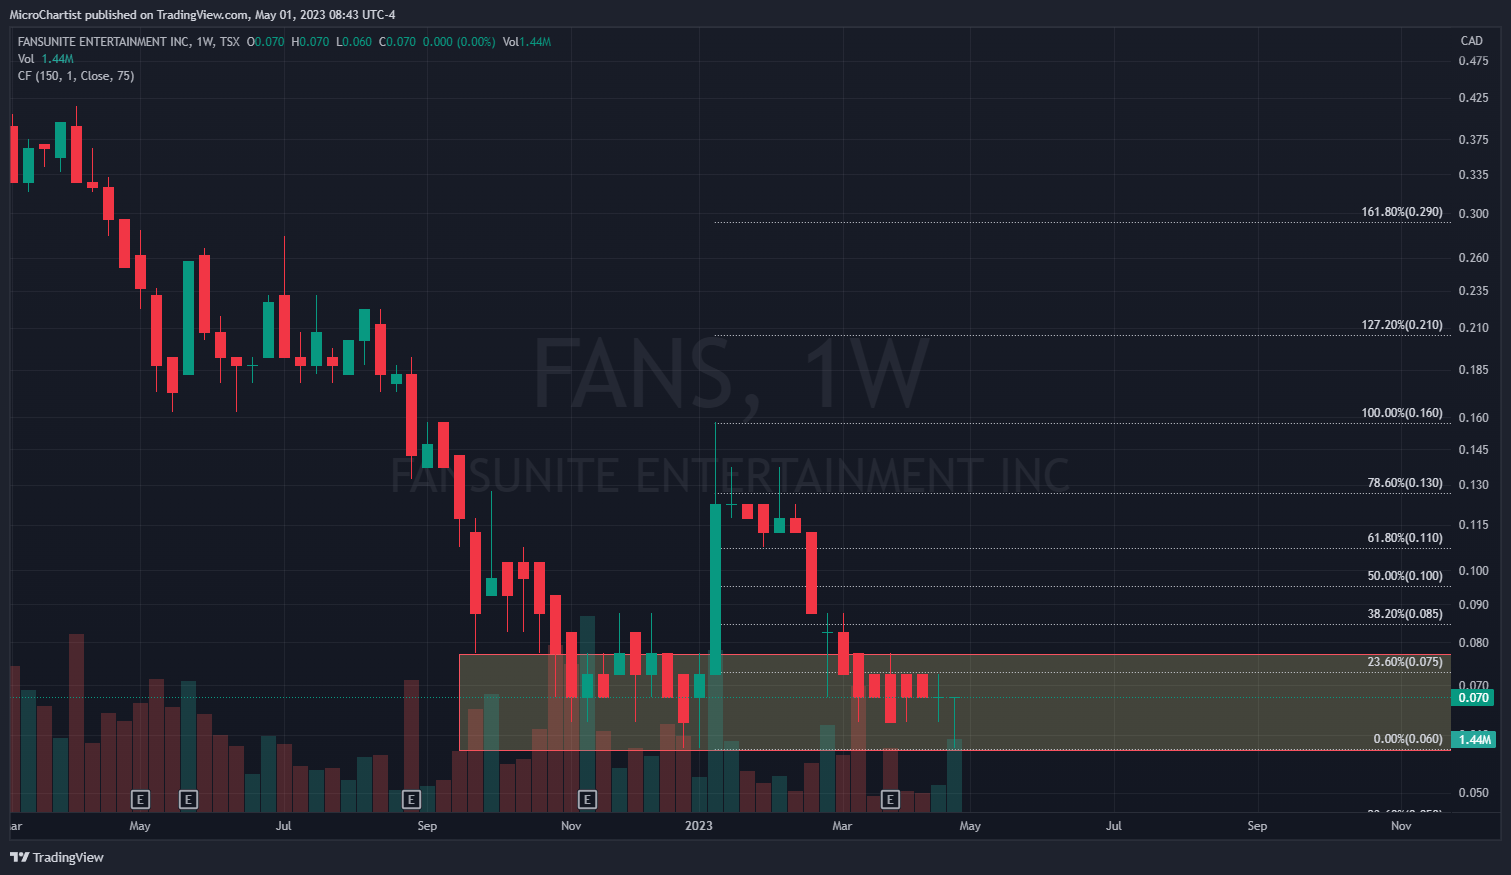
FANS continued to move sideways within the identified range while testing all time lows and completing the 100% retracement of the last upward move.
Bull Case: Support holds at CAD $0.06 / $0.044 USD and price is able to break out of the range to set a new base around CAD $0.09 / $0.066 USD
Bear Case: The 52w low breaks, and new all time lows are made. The price then ranges around CAD $0.05 / USD $0.037 which is the next fib retracement level.
9. ACT / ACTHF – Lower lows and downside pressure.
ACT/ACTHF Monthly closing price: CAD $0.88 / $0.66
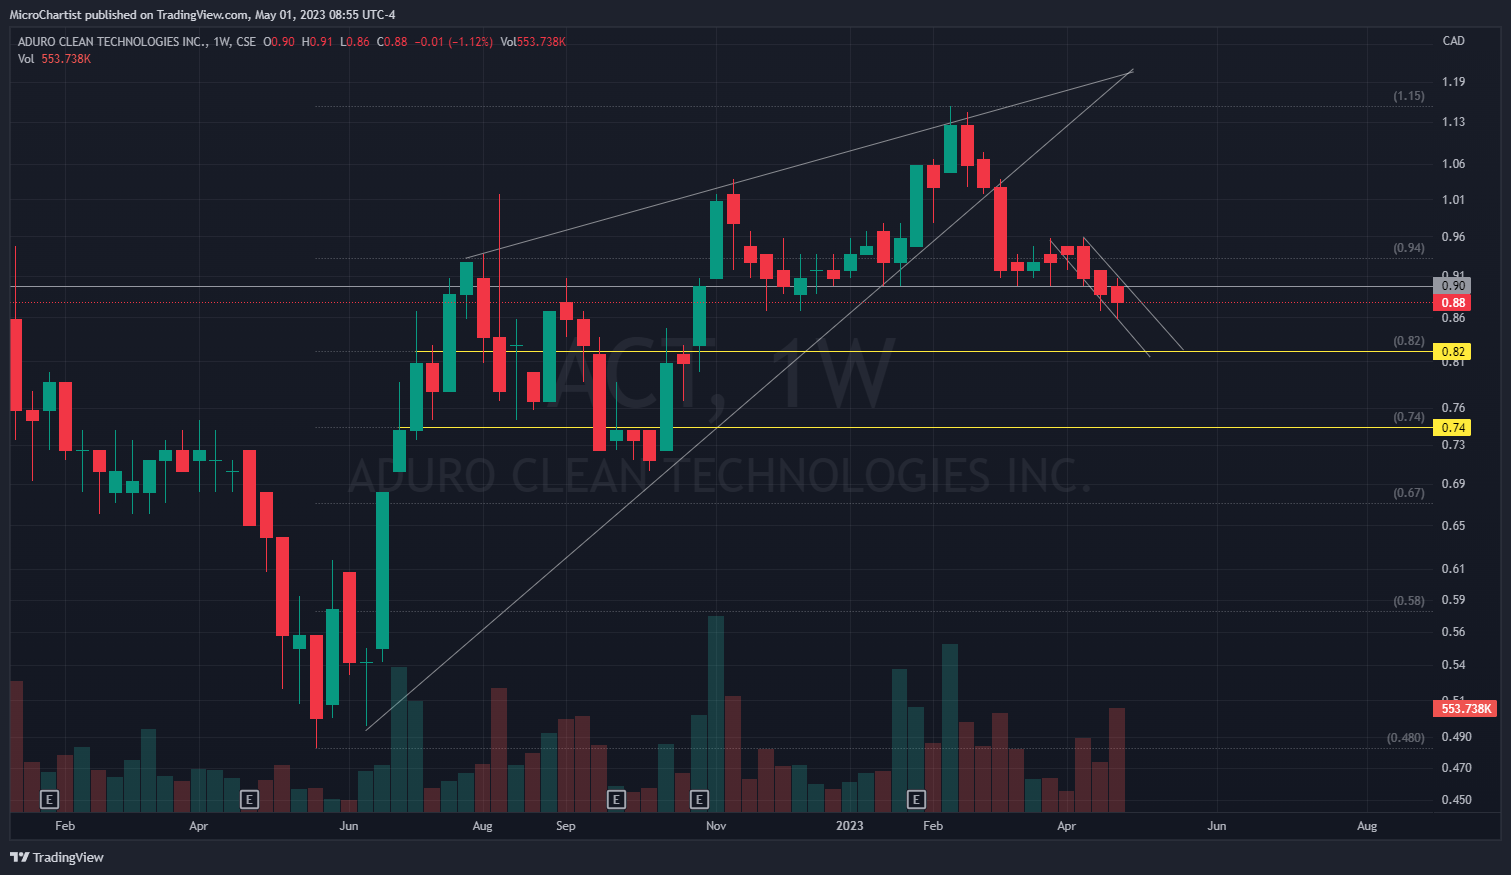
My previous analysis for ACT was incorrect, as it continued to make lower lows and broke below the range that I thought was most likely. The price is now moving within a downward channel.
Bull Case: The floor gets set at CAD $0.86 / $0.63 USD as support holds at this level, before climbing back above CAD $0.90 / $0.66 USD and ranging around CAD $0.93 / $0.69 USD.
Bear Case: I believe a more likely floor will be at CAD $0.82 / $0.60 USD and if that breaks then I think the price will drop to CAD $0.74 / $0.55 USD. Both of these prices coincide with the next fib retracement levels and they align with the chart’s historical prices.